Inspired by that, I created similar maps for Alexandria using data from the city's GIS Division.
Basic Land Use
This map simplifies the city's zoning into four categories: commercial, residential, designated mixed use/"coordinated development" zones, and other (everything else). The commercial corridors along King St, Washington St, and Mt Vernon Ave really stand out on this map, as do the designated mixed-use or "coordinated development" areas that reflect recent development (Carlyle), new development (Potomac Yard), or proposed redevelopment areas (Beauregard).
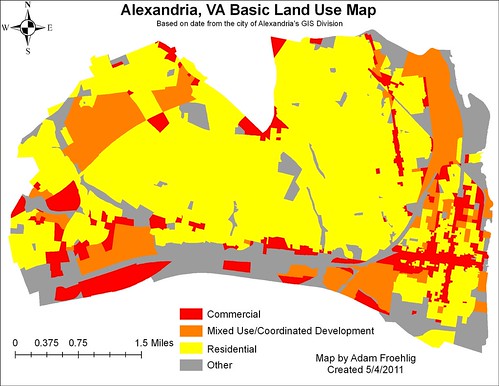
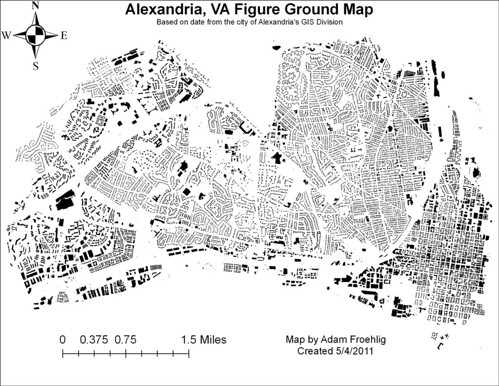
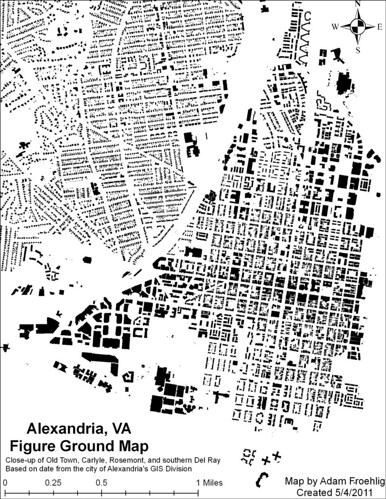
Figure Ground Map
These maps show building footprints. The first one is citywide, while the second one is a zoom-in showing Old Town, Carlyle, Rosemont, and the southern part of Del Ray. While not as "thick" as DC, there is some noticeable density in Old Town.
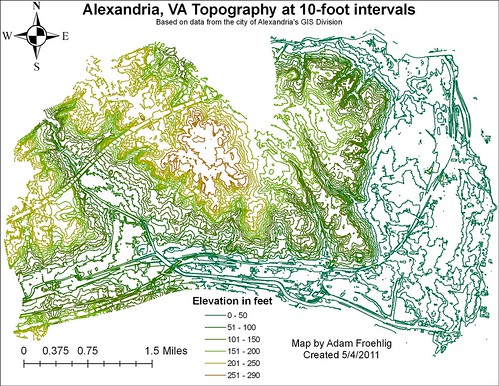
Topography
This map details the city's topography, with contours at 10 foot intervals. The highest point in the city is located in Fort Ward Park. Other noted areas of elevation are the ridge along Seminary Rd, the Landmark area, and the far southwestern corner of the city near the Beltway/Van Dorn St interchange (technically outside the city limits but included in the data package).
Some man-made and other features can also be easily seen in the topography, including I-395, the Beltway, the Beltway/Telegraph Rd interchange (before the Wilson Bridge-related construction began) and the CSX tracks. Also easily visible are the Cameron Run channel, Holmes Run, Backlick Run, and part of Four Mile Run.
No comments:
Post a Comment