Geographic Variation Is Explained by Disease

In a new paper in Medical Care Research and Review, Reschovsky, Hadley and Romano have shown quite conclusively that geographic variation in health care spending is related to the burden of illness and little else. Of course, the burden of illness is greatest among the poor, and the two are strongly correlated, so, indirectly, they also showed that geographic variation is related to poverty and little else.

Their study examined health care spending in 60 regions that have been studied for many years by the Center for Health Systems Change, shown below.Hadley Variation Map

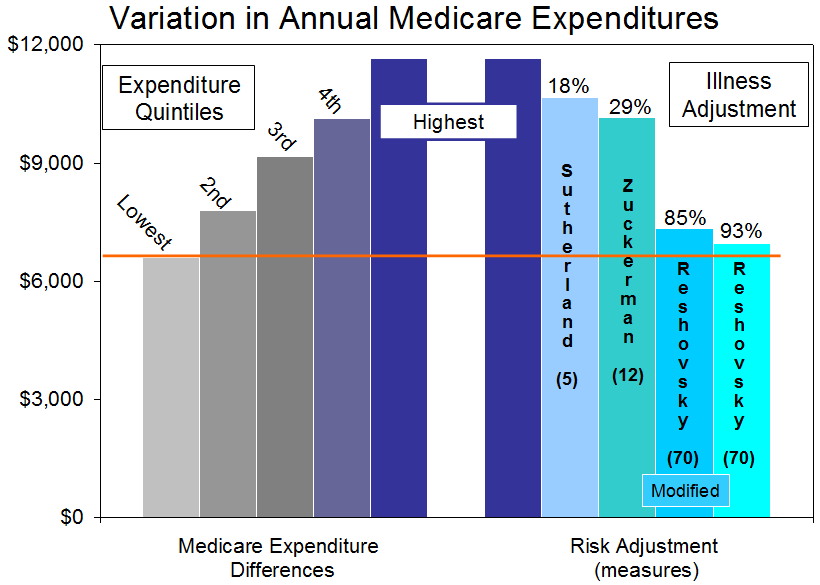
The graph below summarizes the data. Medicare expenditures varied widely, as had been observed in studies using the Dartmouth Atlas. Dartmouth’s earlier studies (not shown) corrected for age, gender and black race but nothing more, believing that there was no need to correct for illness levels because the expenditures that Dartmouth studied were in the last two years of life, and since everyone was similarly dead, they all must have been similarly ill, a conclusion which, aside from being absurd, has been shown to be false, most completely in the Reschovsky study. Sutherland and coworkers from Dartmouth approached the question by studying patients in the Medicare Current Beneficiary Survey. After the standard adjustment for demographic factors, they adjusted the data using five disease parameters and found that such as adjustment explained 18% of the variation between the extremes of expenditure quintiles. Zuckerman and colleagues carried out an identical study but applied 12 disease parameters, and they explained 29% of the variation. Reschovsky et al utilized 70 disease parameters within the hierarchical condition category (HCC) model developed for the Centers for Medicaid and Medicare Services (CMS) and found that illness levels explained 93% of the variation. Even using a modified version to remove observer bias in charting illness, disease burden accounted for 85% of the variation.

Hadley VariationIsn’t it time to stop this foolishness about geographic variation being a manifestation of variation in practice? Wouldn’t it have been wonderful if that could have occurred before all of the foolish incentives and penalties were written into Obama-care? Shouldn’t someone be held accountable for deceiving congress, distorting the practice of medicine and bilking the profession?  Isn’t it time that the high health care costs of poverty became a focus of national attention? Don’t we owe our children a health care system that they can sustain? Won’t it take honest, critical research (like Reschovsky’s) to get us there?

More War on Waste: Do Hospitals Profit from Complications?

Gawande has struck again, concluding in his recent JAMA article that “some hospitals have the potential for adverse near-term financial consequences for decreasing post-surgical complications” (aka, they’ll make more profit if they let complications happen). In a follow-up article entitled “Hospital Profits Linked to Patients with Surgical Complications,” the Huffington Post rephrased it this way: “Patients who suffer complications after surgery are lucrative for hospitals.” How grotesque.

And in an accompanying editorial, Reinhardt, the economist who trumpeted the “physician surplus” 15 years ago when that was popular, quickly added that the fault may be the fee-for-service payment system that rewards volume rather than quality, today’s bandwagon. And everyone has jumped on the band wagon. But remember McAllen? Everyone jumped on that, too. It took a while to figure out that the McAllen story was poppycock.

First, what were these complications? More than half were MIs, cardiac arrests, pneumonias or strokes. Another 15% were use of a ventilator for more than 96 hours, which is never preventable (one wishes it could be). Only 10% were wound-related (a total incidence of 0.5%). None were events that physicians or hospitals want. The remarkable thing is how few of the complications were avoidable. How do you prevent a stroke? Nonetheless, the implication was that hospitals and their doctors egregiously and selfishly tolerate errors to increase profits and that the fee-for-service system enables such behavior. Once again, the public has been poorly informed.

So how did hospitals profit from all of this? Please bear with me because the numbers in the article are a little complicated. I will try to simplify them.

For uncomplicated patients, who length of stay averaged 3 days, the margin earned by hospitals, after paying for variable costs (nurses, medications, etc.), was a little over $2,500 per day, a total of $7,600 for a 3-day admission.

Complicated patients stayed an extra 11 days, and although the margin for them was less (about $750 per day), the extra 11 days yielded an extra $8,100. That is what led Gawande et al to claim that hospitals make more. An extra $8,100 per admission.

The problem is that hospitals don’t run on variable costs alone. There are fixed costs, like buildings, maintenance, equipment, administrative staff, etc. In the Gawande study, these were $2,200 per day. When these were also considered, uncomplicated patients produced a net profit of $300 per day for 3 days, yielding a total profit of $1,000 per admission. Complicated patients produced a loss of $765 per day for 11 days, or $8,400, which was offset by a surplus of $1,000 from the first 3 days to yield a net loss of $7,400 per admission.

How do complications make money for hospitals if complicated patients are a loss? Gawande’s answer is that the hospitals aren’t full anyway, so the fixed costs are there with nobody to pay for them, and whatever extra revenue can be derived from complications is simply gravy, even if it’s less than the revenue from uncomplicated patients.

The implication is that hospitals encourage or at least permit complications to keep their beds full and earn an extra $750 per day. But how do they promote MIs or pneumonia, and do they really keep people on ventilators needlessly for more than 96 hours? Unfortunately, no one will look at the details. They didn’t in McAllen, either. JAMAs editors must nor have looked at the details, either.

And so, the “War on Waste” continues. To win that war, it is said, the US must get rid of fee-for-service reimbursement, which, in Reinhardt’s words, “can tempt otherwise admirable people into dubious conduct.”

Yes, as the events in Boston vividly showed, they are admirable. They are professionals. They deal with patients who will assuredly have complications that no one wants nor can avoid, least of all the physicians who are caring for them and the hospitals in which they are receiving care.

Not Your Usual Primary Care Provider

Physician shortages are being disproportionately felt in primary care, as fewer physicians practice office-based primary care and as more NPs and PAs work in specialty practices. Who will provide direst access care, how will they be trained and what will they be able to do?

The Academic Consortium for Alternative and Complementary Health Care has published a report on the current and prospective roles of doctors of chiropractic, naturopathic physicians, doctors and practitioners of acupuncture and Oriental medicine and direct-entry midwives in meeting nation’s primary care needs. In aggregate, there are about 100,000 practitioners in these fields (see below), most in chiropractic.AACCAHC

This new report, “Meeting the Nations Primary Care Needs,” offers an opportunity to learn what these professions are doing and to assess the extent to which they could participate in meeting some of the unmet needs in primary care. It is the best compendium of thoughtful analysis on these disciplines that currently exists. Are the authors correct? Is this a way to meet the nation’s needs? Comments from readers of this blog will be welcomed! 

Critical Access Hospitals: The Canary in the Mine for Specialist Shortages?

An article in the April 3rd issue of JAMA describes the higher mortality from acute MI, congestive health failure and pneumonia in critical access hospitals (CAHs) (small hospitals in sparsely populated areas). The authors reasoned that the difference was due to the fact that most hospitals have quality reporting programs but CAHs do not. But CAHs lack another important ingredient: specialists. While the counties with and without CAHs had similar numbers of generalist physicians (about 50 per 100,000), counties with CAHs averaged only 14 specialists per 100,000 while other counties averaged 100 specialists per 100,000, a seven-fold difference.

Over the period of observation (2002-2010), mortality improved in some CAHs but not in others. There was no difference in the average numbers of generalists in the counties where improvement occurred vs. where it did not, but the number of specialists was 30% greater in the counties where mortality in CAHs improved.

There was a lot of variability in the data, so the statistics are not strong. But we know that the evolving specialist shortage hits remote areas first. Are CAHs showing us what happens when there aren’t enough specialists? Could CAHs be the canary in mine?

Readmission Legislation is Harming Hospitals that Care for Poorer and Sicker Patinets

This blog post was originally published on the Action for Better Healthcare site on Jan 6, 2010 (http://actionforbetterhealthcare.com/?p=250). It warned that policies directed toward stemming readmissions would harm the poor. Not surprisingly, it proved to be prophetic, as demonstrated by data from a recent article by Joynt and Jha, which is inserted at the end of this post.

*********************************************************************

Jan 6, 2010…. It may surprise you to learn that the pending “Health Care Reform” legislation authorizes the Secretary of Health and Human Services to identify “excess hospital readmissions” and penalize hospitals that have more of them. Payments for all Medicare discharges would be reduced by up to 3% (Senate bill) or 5% (House bill), depending on the number that were deemed to result from “excess readmissions.”

There is justifiable concern about readmissions. According to MedPAC, 18% of hospitalizations among Medicare beneficiaries resulted in readmission within 30 days, accounting for $15 billion in spending. MedPAC concluded that, simply based on their relationship to an earlier admission, 84% were potentially preventable.

The current bills give the Secretary enormous discretion in the choice of methods and measures – no administrative or judicial review would be permitted, although the Senate bill calls for the use of the same methods now used by CMS. The problem is that CMS finds much greater variation in readmission rates among the nation’s approximately 4,000 hospitals than is found when epidemiologically-sound risk adjustment is made. For example, while CMS found that 14% of hospitals had readmission rates for congestive heart failure that were 2% or more beyond the median, only 3% of hospitals had rates beyond this range when epidemiologically-sound methods.

Factors that are recognized as affecting readmissions include older age, multiple comorbidities and mental health conditions. But the strongest, yet least frequently measured, is income. More than 20 years ago, Starfield and colleagues found that admissions and readmissions among asthma patients in Maryland were principally associated with poverty. A decade later, Ricketts found the same for all readmissions in North Carolina. In a careful series of studies, Billings found “an extraordinarily strong association” between admission rates and patients’ ZIP code incomes in New York, Miami and other cities, with rates four times higher in low-income areas than in affluent ones, an observation that we confirmed in Milwaukee. Income explained more than 80% of the variation among ZIP codes. And this is not unique to the US. Across Canada, hospitalization rates for treatable conditions were twice as high in low-income neighborhoods. Poverty matters.

No! Stop that blather. We have to find ways to pay for health care reform and to rein in all of those greedy hospitals and specialists who are causing America’s health care costs to soar. It’s ok to penalize the providers who care for the poor. More of their patients will be insured anyway…… But wait. If poverty is the central problem, maybe we could focus on that, and if we did, maybe we could produce better health and a more affordable health care system. Now that would really be reform.

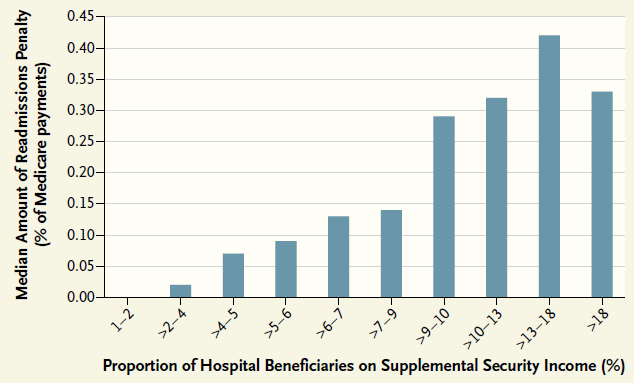
***********************************************************************The figure that follows, which was taken by a recent paper in the NEJM by Joynt and Jha, shows how the readmission penalties that resulted from the ACA disproportionately harm hospitals that care for patients receiving Social Security Disability. Yes, utilization is greater and  readmissions are more frequent among patients who are sicker and poorer.

Readmissions Joynt-Jha

Federal Reserve Paper: Geographic Variation Can’t Tell Much about Efficiency or Quality

Why the Geographic Variation in Health Care Spending Can’t Tell Us Much about the Efficiency or Quality of our Health Care System  Louise Sheiner, Federal Reserve Board of Governors

Full paper available at: http://www.federalreserve.gov/pubs/feds/2013/201304/201304pap.pdf

ABSTRACT:  This paper examines the geographic variation in Medicare and non-Medicare health spending and finds little support for the view that most of the variation is attributable to differences in practice styles. Instead, I find that socioeconomic factors that affect the need for medical care, as well as interactions between the Medicare system, Medicaid, and private health spending, can account for most of the variation in Medicare health spending. Furthermore, I find that the health spending of the non-Medicare population is not well correlated with Medicare spending, suggesting that Medicare spending is not a good proxy for average health spending by state. Finally, there is a negative correlation between the level and growth of Medicare spending; lows pending states are not low-growth states and are thus unlikely to provide the key to curbing excess cost growth in Medicare.

The paper also explores the econometric differences between controlling for health attributes at the state level (the method used in this paper) and controlling for them at the individual level (the approach used by the Dartmouth group.) I show that a state-level approach is likely to explain more of the state-level variation associated with omitted health attributes than the individual level approach, and argue that this econometric differences likely explains most of the difference between my results and those of the Dartmouth group.

More broadly, the paper shows that the geographic variation in health spending does not provide a useful measure of the inefficiencies of our health system. States where Medicare spending is high are very different in multiple dimensions from states where Medicare spending is low, and thus it is difficult to isolate the effects of differences in health spending intensity from the effects of the differences in the underlying state characteristics. I show, for example, that the relationships between health spending, physician composition and quality are likely the result of omitted factors rather than the result of causal relationships.

Note: This is a staff working paper in the Finance and Economics Discussion Series (FEDS), Divisions of Research & Statistics and Monetary Affairs, Federal Reserve Board, Washington, D.C.

POVERTY and the WAR on WASTE

Why does the US spend so much on health care, and what is (and is not) being done about it. The answer to “why” is embedded in a narrative that goes something like this: The US spends twice as much as other rich countries, yet its outcomes are among the poorest. This is partly due to higher prices and administrative costs but mainly to “America’s distorted fee-for-service system that rewards quantity over quality and creates a gigantic incentive for inefficiency and waste.” The Institute of Medicine estimates this waste at about 30% of health spending—$750 billion.

Waste has become the mantra of healthcare reform, and it is one of the few issues upon which Republicans and Democrats agree. Indeed, sitting across the table from each other on Fareed Zacharia’s Sunday morning show on Dec 23, Glen Hubbard, a voice of the right, and Peter Orszag, a voice on the left, agreed. The US budget would never be balanced without entitlement reform, and the major reform will have to be in Medicare, and the major problem in Medicare is “waste,” so there’s a lot hanging on this narrative.

Having identified “waste” as the principal cause of high healthcare spending, policy experts have mounted a “war on waste.” In waging this war, Republicans look principally to market forces, while Democrats look to the  Affordable Care Act (ACA). According to the Brookings Institution health economist Henry Aaron, the ACA includes “virtually every cost-control idea that anyone has come up with.” Their intent is to redirect care from high-cost specialists to low-cost primary care physicians; reorganize care into medical homes and accountable care organizations; restructure reimbursement from fee-for-service to value-based purchasing and bundled payments; and utilize incentives and penalties to incentivize providers to attain quality benchmarks, adhere to designated clinical guidelines, reduce hospital readmissions, adopt electronic health records and counsel patients concerning certain preventable conditions. This entire portfolio is supported by an expansive regulatory framework and subject to future actions by an Independent Payment Advisory Board.

The ostensible goals of the “War” are to shift the emphasis from volume to value and reduce the growth of spending. Yet few of the “cost-control ideas” were validated before being adopted, and recent studies indicate that few are achieving their stated purposes. Indeed, some have added costs with no parallel benefit. Nonetheless, providers feel they must respond, and they are rechanneling their efforts from identifying innovative solutions to satisfying regulatory standards.

Whether or not the ACA’s cost-saving goals are achieved, the “war” will decisively move the locus of control from physicians to regulators and administrators. As Berwick predicted, “no longer will physicians, paternalistically committed to their patients, be the driving force in medical care. Health care has become an industry, with numerous loci of authority well beyond the doctor’s office.”

It is not difficult to identify wasteful practices. Indeed, addressing them is a continuing professional responsibility. The question is whether they account for as much as 30% of healthcare spending. While several authoritative “guesstimates” claim they do, the quantitative basis for believing so comes from studies of geographic variation in healthcare by Dartmouth Atlas researchers, who identified a portion of the variation that is “unexplained,” attributed it to waste and inefficiency and pegged it at 30% of spending. Although widely cited, these studies are deeply flawed. Indeed,  in an op-ed in the Washington Post, I warned that the Dartmouth Atlas was the “wrong map for healthcare reform.”

What, then, explains the “unexplained” variation? The answer resides in population health. It is well known that disease prevalence is greatest among individuals who are poor, poorly educated, often minorities and usually residing in densely poor neighborhoods. It should not be surprising that healthcare utilization among them is much greater than within more affluent populations. Yet their outcomes are poorer. And because poverty is geographic, their increased utilization follows geographic patterns.

Like Milwaukee and Los Angeles, which my colleagues and I described previously, Manhattan is a good example of the impact of poverty. Because healthcare utilization in Manhattan is among the nation’s highest, it is seen as wasteful and inefficient. But Manhattan is a patch-quilt of low and high-income neighborhoods. Utilization in the low-income Bowery is double the rate of the affluent Upper East and Upper West Sides, and utilization in Harlem, the poorest area, is more than triple. Without either, hospital utilization in Manhattan is among the lowest in the nation, lower even than Grand Junction, Colorado, whose healthcare system was held out by President Obama as a model for the nation. But like Grand Junction, the Upper East and West Sides of Manhattan have few African-Americans and no poverty ghettos.

How much does the extra care in poor neighborhoods add to the overall utilization costs within a region? Our studies indicate that it adds about 20% to 25%. Yet, tragically, this fact is ignored—indeed, denied. For example, Dartmouth researchers mockingly note that some physicians believe their hospitals or regions spend more because their patients are sicker and poorer” and declare, “regional differences in poverty explain almost none of the variation.” In like manner, Nicholas Kristof, a columnist for The New York Times and generally an advocate for the poor, labeled as “opponents of health care reform” those who attributed poor outcomes to America’s large underclass. In fact, poverty explains virtually all of the regional differences in utilization, and “America’s large underclass” accounts for virtually all of the differences in outcomes between the US and other nations.

Real healthcare reform would address these socioeconomic realities. Instead, the US is waging a regulatory “War” on exaggerated measures of waste, one that shows little promise of reducing costs or increasing quality but that will assuredly crush needed innovation by practicing physicians, who best understand the delivery of care. Moreover, because there are no risk adjusters for poverty, physicians whose low-income patients fail to meet federal utilization and quality norms will suffer financially, and hospitals whose poor patients have high readmission rates will be penalized. All the while, the “War on Waste” will distract policymakers from building the social infrastructure that could lower the high healthcare costs of poverty. These are no ordinary times. For the first time, physicians and their patients are caught in the cross-hairs of a “War on Waste.”

(This blog post is taken from Cooper, “The War On Waste,”  Oncology, November 15, 2012)

It’s Official: There IS a Physician Shortage

The New York Times has made it official. There is a physician shortage: “Doctor Shortage Likely To Worsen with Health Care Law”

They’ve published that news as their lead story today, although they didn’t report the news that shortages were developing when we published our model in Health Affairs a decade ago: http://content.healthaffairs.org/content/21/1/140.long

And they paid no attention when we reviewed the evidence two years later in the Annals of Internal Medicine and implored our colleagues to take action: “The medical profession has long accepted the responsibility for assuring adequate numbers of competent physicians. Fulfilling that responsibility is an obligation that it must now embrace.”  http://annals.org/article.aspx?articleid=717927

And they looked the other way when, in the Annals of Surgery three years later, we pleaded for more residents to fix the problem: “If we do not rise to meet the challenge, future generations will wonder what ours was all about, what purpose was served by allowing a great profession to stagnate and why they and their loved ones must experience illness without access to a competent and caring physician.”  http://www.mhc.org/docs/2007_cooper_ann_surg_gme.pdf

But now, at last, they have identified the problem. There are too few physician, and its getting worse, and the lack of adequate numbers of physicians will undermine the goals of health care reform and harm the health of the nation. http://www.nytimes.com/2012/07/29/health/policy/too-few-doctors-in-many-us-communities.html?hp

Sadly, as the Times article notes, “Health experts, including many who support the law, say there is little that the government or the medical profession will be able to do to close the gap by 2014, when the law begins extending coverage to about 30 million Americans.  It typically takes a decade to train a doctor.” And that is exactly why we urged action a decade ago.

So, thanks to Annie Lowrey and Robert Pear and the New York Times for finally making it official. I hope these influential journalists and their influential newspaper will go the next step and call for expanding Graduate Medical Education. That is the key to meeting the needs in the future.

Poverty, Wealth and Health Care Utilization: A Geographic Assessment

http://www.springerlink.com/content/d647854766vt4688/fulltext.pdf

The test of our progress is not whether we add more to the abundance of those who have much.  It is whether we provide enough for those who have too little.   Franklin D. Roosevelt, 1937  

ABSTRACT   Geographic variation has been of interest to both health planners and social epidemiologists. However, while the major focus of interest of planners has been on variation in health care spending, social epidemiologists have focused on health; and while social epidemiologists have observed strong associations between poor health and poverty, planners have concluded that income is not an important determinant of variation in spending. These different conclusions stem, at least in part, from differences in approach. Health planners have generally studied variation among large regions, such as states, counties, or hospital referral regions (HRRs), while epidemiologists have tended to study local areas, such as ZIP codes and census tracts.

To better understand the basis for geographic variation in hospital utilization, we drew upon both approaches. Counties and HRRs were disaggregated into their constituent ZIP codes and census tracts and examined the interrelationships between income, disability, and hospital utilization that were examined at both the regional and local levels, using statistical and geomapping tools.

Our studies centered on the Milwaukee and Los Angeles HRRs, where per capita health care utilization has been greater than elsewhere in their states. We compared Milwaukee to other HRRs in Wisconsin and Los Angeles to the other populous counties of California and to a region in California of comparable size and diversity, stretching from San Francisco to Sacramento (termed “San-Framento”).

When studied at the ZIP code level, we found steep, curvilinear relationships between lower income and both increased hospital utilization and increasing percentages of individuals reporting disabilities. These associations were also evident on geomaps. They were strongest among populations of working-age adults but weaker among seniors, for whom income proved to be a poor proxy for poverty and whose residential locations deviated from the major underlying income patterns.

Among working-age adults, virtually all of the excess utilization in Milwaukee was attributable to very high utilization in Milwaukee’s segregated “poverty corridor.” Similarly, the greater rate of hospital use in Los Angeles than in San-Framento could be explained by proportionately more low-income ZIP codes in Los Angeles and fewer in San-Framento. Indeed, when only high-income ZIP codes were assessed, there was little variation in hospital utilization among California’s 18 most populous counties. We estimated that had utilization within each region been at the rate of its high-income ZIP codes, overall utilization would have been 35 % less among working-age adults and 20 % less among seniors.

These studies reveal the importance of disaggregating large geographic units into their constituent ZIP codes in order to understand variation in health care utilization among them. They demonstrate the strong association between low ZIP code income and both higher percentages of disability and greater hospital utilization. And they suggest that, given the large contribution of the poorest neighborhoods to aggregate utilization, it will be difficult to curb the growth of health care spending without addressing the underlying social determinants of health.

Health Care Spending and GDP in One Chart

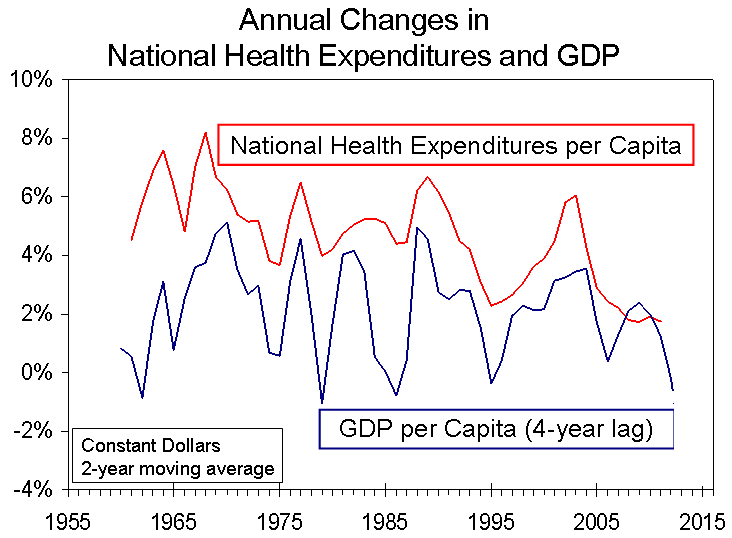
There has been a great deal of discussion about the recent decreases in the rate of growth of health expenditures, and there has been a tendency to attribute it to the early effects of health care reform. In fact, while such effects may lie in the future, the major reason that health care spending growth has slowed is that economic growth has decreased. This relationship is most apparent when health care spending today is compared with GDP several years ago. The reason for this lagged relationship has been described by Getzen and others. It relates to the expansion of health benefits, services, employment, etc. when business profits are up and tax revenues are strong and the reverse when economic reversals occur, always with a lag between changes in the macroeconomy and the ripple effect on health care spending. The illustration below tells the tale. There must certainly be other reasons for fluctuations in health care spending, but most is explained by preceding fluctuations in economic growth.