This paper provides a radical reinterpretation of the dynamics that drive atmospheric temperature in the stratosphere and upper troposphere and how this drives temperature at the surface. It is embarrassingly at odds with mainstream climate science. Nevertheless, I proceed with cautious deliberation.
Manifestly, the engine of climate change is in the tropics. Here, energy gain from solar radiation exceeds emission via radiation. The energy gain, more at some times than others, is transferred to high latitudes by the ocean and the atmosphere. To understand climate change we have to understand the Southern Oscillation that governs the warming and cooling of the tropics and also how that oscillation changes over time.
The suns total irradiance varies by 0.1% over the solar cycle and is out of step with the observed change in surface temperature. At the height of the sunspot cycle a La Nina cooling event is frequently experienced. Plainly, the temperature of the Earth is unrelated to the sunspot cycle. However, there is a second mode of variation in solar activity that is deterministic. This is the Quasi Biennial Oscillation.
QUASI-BIENNIAL OSCILLATIONS OF THE SOLAR MAGNETIC FIELDS E.V. Ivanov, V.N. Obridko, B.D. Shelting
Quasi-biennial oscillations (QBO) in various active events in the Sun are the second most powerful variation after the 11-year cycle. They are stable harmonic oscillations with a period changing noticeably from ~1.5 to ~3.0 years. QBO have been detected in the dynamics of sunspot indices, active longitudes, activity indices in the polar zone, magnetic field of the Sun as a star and large-scale field, solar irradiance, neutrino flux, coronal mass ejections, solar wind and heliospheric parameters, and geomagnetic activity.
The heating modes of the Earth
Plainly it is variation in cloud cover that causes the temperature at the surface to rise and fall. Cloud cover depends upon atmospheric temperature and moisture status. Atmospheric temperature in the upper troposphere and the stratosphere is strongly mediated by the flux in ozone. How can the ozone concentration change? In early 2009 the mechanism was graphically demonstrated by the Earth itself.
In January and February 2009 a massive warming event occurred in the Arctic night zone. This occurred as the polar night jet (the Arctic Vortex) collapsed. The ozone content of the polar stratosphere and all northern latitudes increased as the supply of erosive nitrogen from the mesosphere was cut off. Simultaneously, and this is a critical observation, the temperature in the tropical stratosphere fell. At the same time the tropical ocean warmed as did the ocean between 20° to 30° south latitude. This conjunction of events, manifesting strongly over a short interval in time, demonstrated how change occurs in stratospheric ozone, cloud cover in the upper troposphere and the flux of energy into the ocean. The event and the process is described at: https://climatechange1.wordpress.com/2009/03/08/the-atmosphere-dancing-in-the-solar-wind-el-nino-shows-his-face/
The current post looks at temperature in the stratosphere in order to document how the vortex changes on ENSO and longer time scales thereby changing the basic parameters of the climate system. The climate system that we have today is essentially different to that of yesterday and what we will have tomorrow. Unless we understand that, we can not model it.
In order to remove the seasonal influence all data is presented as a 12 month moving average centred on the seventh month. In this work I use data from Kalnay, E. and Coauthors, 1996: The NCEP/NCAR Reanalysis 40-year Project. Bull. Amer. Meteor. Soc., 77, 437-471.
This dataset is available via the web at:
http://www.cdc.noaa.gov/cgi-bin/Timeseries/timeseries1.pl
Dynamics driving temperature at different levels in the stratosphere
In figure 1 the orange line (10hPa pressure level) unambiguously reflects the impact of ionising short wave radiation on the upper stratosphere. Short wave radiation from the sun splits the oxygen molecule enabling the creation of ozone. At 10hPa there is insufficient oxygen to create much ozone. Below 50hPa there is insufficient short wave energy to create ozone from abundant oxygen. So ozone concentration peaks at 20-30hPa suggesting that ionising radiation (UVC) penetrates the atmosphere to at least this level.
How far down does the solar influence penetrate? Ruzmaikin 2007 found strong ozone and temperature 27-day variations (relative to their mean values) near the bottom of the stratosphere at 100hPa. Strong 27-day modes (solar rotation timescale) were also seen at high latitudes in the winter.
At 10hPa the flux in ozone concentration is no doubt less than it is at intermediate levels but contributes to the temperature variation. However since it is on a small base the change in ozone content must be less influential in determining 10hPa temperature than the flux in radiation. By contrast, at 100hPa and 200hPa it appears that the flux in UVB and dynamic influences involving vertical transportation of ozone rich air may be involved and the flux in ozone content is a very important determination of temperature in the lower stratosphere and upper troposphere.
General relationship between temperatures in the stratosphere, the upper troposphere and at the surface
Figure 1 shows change in deseasonalised monthly temperature at selected intervals between sea surface and the 10hPa atmospheric pressure level. All data relates to the equator to 10°N band of latitude with the exception of sea surface temperature which relates to the latitude band 20°N to 20°S.
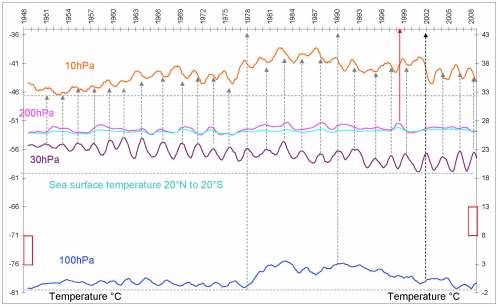
Fig. 1 Temperature at selected levels between sea surface and 10hPa in the stratosphere
Sea surface temperature can be read off the right axis. The left axis relates to sub zero temperatures at 200hPa (upper troposphere 10km), 100hPa (tropopause 15km), 30hPa (highest ozone content, 22 km) and 10hPa (limit of database for stratosphere, 30km). The axes are adjusted so that a degree centigrade has the same absolute interval in both. The little red rectangles equate to 5°C. I use these rectangles to remind myself that the two axes have been adjusted so that all curves relate properly.
It is immediately apparent that sea surface temperature is much less volatile than atmospheric temperature at all levels above 200hPa. What is this volatility due to?
- In the mid and upper stratosphere irradiative wave lengths shorter than 242nm are wholly absorbed by oxygen releasing energy that is taken up by the local atmosphere.
- Where ozone is present, wave lengths between 200 and 320nm are absorbed. This releases energy at all elevations where ozone is present, even down to 200hPa.
- The excitation of ozone by long wave (infrared spectrum) radiation emitted by the Earth and the lower atmosphere. This releases energy mainly at 150hPa, 100hPa and to a lesser extent 70hPa.
Plainly the temperature oscillation is strongest at 30hPa. With 27 warming events over a period of sixty one years the average period of the Quasi Biennial Oscillation in 30hPa temperature is 27.1 months. The QBO is reflected not only in atmospheric temperature but also the concentration of ozone and other trace gases. The oscillation is strongly present between 12°N and 12°S latitude.
Stratospheric temperature is driven by the QBO of magnetic and irradiance activity on the sun. Does that influence extend into the troposphere and drive climate? In particular is the association between warming at the pole, cooling in the tropical stratosphere and warming at the surface a consistent feature of the climate record or just a coincidence that marked the sudden stratospheric warming of early 2009?
First let’s check the relationship between 20hPa temperature (middle stratosphere) and 200hPa temperature (upper troposphere).
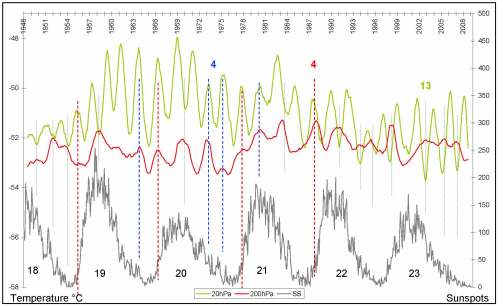
Fig. 2 The QBO at 20hPa compared to temperature at 200hPa in the upper troposphere over five and a half solar cycles
Figure 2 shows the relationship between equatorial temperature at 20hPa, 200hPa and also sunspot numbers. On 13 occasions temperature peaks at 200hPa coincided with the trough of the 20hPa QBO. On 4 occasions (red) 200hPa temperature peaked at the same time as 20hPa temperature. These 4 events coincide with the strong increase in irradiance at the start of the sunspot cycle. On 3 occasions (blue) 200hPa temperature peaked late in the sunspot cycle at the same time as 20hPa temperature and this may also be associated with spurts in irradiance. On 1 occasion 200hPa temperature peaked with 20hPa temperature at the height of sunspot cycle 21 and the reason for this escapes me.
If the atmospheric shift between the pole and the equator depends upon the twin influences of adequate short wave radiation to ionise the atmosphere and the solar wind to apply the shifting impetus, then under conditions of low solar wind pressure, an increase in UV irradiance should facilitate the shift. Without ionisation little shifting should be possible. In the first year of a new solar cycle the solar wind is weak. A heavy increase in irradiance is needed to compensate for this weakness.
This analysis confirms that warming of the upper troposphere is most frequently associated with a depression of temperature in the tropical stratosphere. Warming of the upper troposphere is also associated with times when sunspot numbers are strongly advancing. Occasionally the QBO oscillation in the stratosphere is not associated with change in 200hPa temperature or the response is weak. This appears to be associated with periods following major warming events like those of 1958, 1983 and 1998.
Polar stratospheric warmings
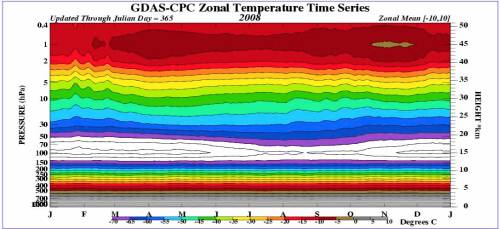
Fig. 3
In figure 3, illustrating temperature change in the equatorial stratosphere over a single year, three episodes of abrupt stratospheric cooling appear in January and February. These cooling events coincided with sudden warmings of the Arctic stratosphere. The stratospheric cooling events at the equator are evident in deflection of the isotherms at all levels between 100hPa and .04hPa. Similar cooling episodes, less abrupt in form but longer in duration, are evident between August and October relating to periods of stratospheric warming over Antarctica. These phenomena can only be due to a redistribution of the atmosphere between the winter pole and the equatorial stratosphere wrought by the twin influence of short wave radiation and flux in the solar wind.
Looking again at figure 3 it is plain that the evolution of evaporation at the surface is reflected in the width of the white zone between 150hPa and 50hPa. At the equator uplift drives cooling at the 100hPa level via decompression. This is the coolest part of the near Earth atmosphere. Figure 7 below shows that the 100hPa level at the equator is the coldest point of the lower stratosphere, considerably colder than the poles. Despite the drying of the rising air, the transport of water vapour into the tropical stratosphere reduces ozone concentration. This is evident in the long term cooling of the tropical stratosphere between 50hPa and 30hPa that has accompanied the recent warming of the tropical oceans. It is also evident in the latitudional temperature profile in figure 11.
Long term change in equatorial 10hPa temperature
10hPa temperature rose strongly, particularly after1978. The period of peak temperature at 10hPa occurred between 1983 and 1987. From 1990 to 2002, 10hPa temperature stabilized at a high level but cooling set in after 2002. 10hPa temperature has since settled at levels that prevailed in the 1970’s. I suggest that this long term flux in temperature at 10hP is one indicator of the intensity of the solar irradiative force at work on the atmosphere. The temperature response at 10hPa was about 7.5 degrees. This is more than that expected from the measured 0.1% increase in total solar irradiance over the solar cycle. Plainly, it is not the change in irradiance that is responsible for this temperature increase at 10hPa. The change in total solar irradiance is immaterial.
Temperature change above 10hPa
Unfortunately the NCEP/NCAR Reanalysis dataset does not extend to the 1hpa level. At 1hPa there appears to be a QBO modulation of the strength of twin temperature peaks in March/April and September/October (see figure 3). I suggest that equinoctial temperature peaks at 1hPa are forced by a relationship between the Earths magnetic field and the solar wind at the solstices. The aa index of geomagnetic activity peaks at this time because the magnetic fields of the Earth and the sun are most closely coupled at the equinoxes. If the temperature of the upper stratosphere were related to orbital considerations alone, there would be a single peak in temperature in January/February when the Earth is closest to the sun. Indeed it seems that the twin influences of UV radiation and the solar wind are influential in driving temperature at all levels in the stratosphere. The unexpected twist is the redistributive effect that is responsible for stratospheric cooling over the equator.
Temperature change at the 30hPa level
The temperature fluctuation at 30hPa reflects both the changing level of ozone and the changing level of short wave irradiance. It is at 20-30hPa that the fluctuation in temperature on the QBO time scale appears to be greatest. It is apparent from figure 4 that there is a progression in the timing of temperature peaks. Temperature peaks initiate earlier at the highest altitude and progress downward over time. This same downward progression is seen in the stratospheric winds over the equator.

Fig. 4 Top down progression of the QBO in the stratosphere
The QBO at the Equator was first apprehended as a reversal of the stratospheric winds from East to West on the QBO time scale. It has been observed that in Westerly phases the polar vortex is deeper and the air colder. In Easterly phases the polar vortex is weaker and more disturbed and the air is warmer
Gabis and Troshichev established that the “Mean level of UV irradiance, averaged for 10 east QBO phases, is about twice as large as that for the west QBO phases”. They have also established that: “The easterly winds descend below ![]() 30 hPa (Stage 2) only under condition of high level of the UV irradiance or steady increase of the UV flux happening in time of the first equinox in course of QBO cycle. If level of UV irradiance is low or UV flux decreases during the equinox, the easterly winds typical of the upper layer, do not descend below 30 hPa.
30 hPa (Stage 2) only under condition of high level of the UV irradiance or steady increase of the UV flux happening in time of the first equinox in course of QBO cycle. If level of UV irradiance is low or UV flux decreases during the equinox, the easterly winds typical of the upper layer, do not descend below 30 hPa.
Predominantly it is during the Easterly phases that the vortex falters, the equatorial stratosphere cools, the equatorial troposphere warms, cirrus density diminishes in the upper troposphere and the tropical ocean warms (Figure 2)
It appears that the increase in UV irradiance in the Easterly phases establishes an atmospheric condition that facilitates the pole to equator shift in the atmosphere. The shift is facilitated by an expansion of the ionosphere. It is the combination of irradiance and solar wind activity that shifts the atmosphere.
In the troposphere temperature difference drive air movement. There is no reason to suggest that the physical laws governing the circulation of the atmosphere are suspended in the stratosphere. However, in the stratosphere the ultimate driver of temperature change is very plainly the sun and it is change in ultraviolet radiation and solar wind pressure that matters.
Change in the parameters of the climate system
Figure 5 traces polar stratospheric temperature over the last five solar cycles. Change in the ozone content and stratospheric temperature in the southern hemisphere represents a fundamental shift in the parameters of the climate system. The southern stratosphere has warmed strongly. This can not happen unless the vortex weakens and the supply of erosive nitrogen from the mesosphere is cut off.
Change in stratospheric temperature is not related to the period of the sunspot cycle. It is related to the stratospheric QBO. Note that the 1978 climate shift (when waters between the Equator and 10°N stepped up 0.5°C) is associated with a dramatic increase in stratospheric temperature over Antarctica. One must remember that the Arctic vortex is not present at the surface in summer whereas it operates all year in Antarctica, albeit at diminished strength in summer when the Arctic vortex is active. It follows that the change in stratospheric ozone wrought by the change in solar activity is expressed mainly in the southern hemisphere. (Enter stage left, the Southern Oscillation). Cooler temperatures over Antarctica in the fifties indicate an ozone hole of much greater magnitude at that time than in the 1990’s pre dating the wide scale use of fluorocarbons in refrigeration.
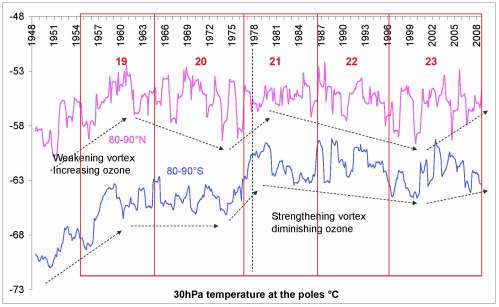
Fig. 5 Change in 30hPa temperature in the Arctic and the Antarctic
The weakening of the vortices is due to a loss of atmospheric density over the pole due to the combined action of ionizing radiation and the solar wind. This interpretation is supported by Figure 6 which shows declining surface atmospheric pressure in the south.
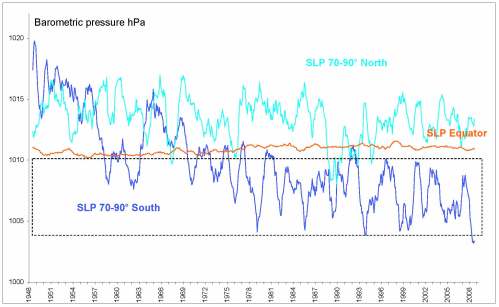
Fig. 6 Changing atmospheric pressure reflecting the tension on the atmsophere imposed by the joint influence of ionization and the solar wind
Sea level atmospheric pressure in Antarctica has been less than at the equator since 1978. This is an extraordinary situation. The natural circulation whereby warm air ascends in a low pressure cell over the equator and is replaced by cold dense air descending within a high pressure zone at the pole is heavily restrained. The combined influence of short wave radiation and the solar wind is antagonistic to the natural circulation. This has led to increased ozone and stratospheric temperature in high and mid latitudes promoting a condition of super responsiveness of the upper troposphere to short wave radiation and a strong run of El Nino warming events.
It is plain that sea level pressure in the south has not changed since 1978. What does the future hold?
NASA reports on solar activity in 2008-9
Measurements by the Ulysses spacecraft reveal a 20% drop in solar wind pressure since the mid-1990s-the lowest point since such measurements began in the 1960s. The solar wind helps keep galactic cosmic rays out of the inner solar system. With the solar wind flagging, more cosmic rays are permitted to enter, resulting in increased health hazards for astronauts. Weaker solar wind also means fewer geomagnetic storms and auroras on Earth.
Careful measurements by several NASA spacecraft show that the sun’s brightness has dropped by 0.02% at visible wavelengths and a whopping 6% at extreme UV wavelengths since the solar minimum of 1996. These changes are not enough to reverse the course of global warming, but there are some other, noticeable side-effects: Earth’s upper atmosphere is heated less by the sun and it is therefore less “puffed up.” Satellites in low Earth orbit experience less atmospheric drag, extending their operational lifetimes.
In relation to NASA’s comment “These changes are not enough to reverse the course of global warming” I can only say that NASA has to take off its cultural blinkers. Solar cycle 23 has already brought a re-adjustment of the climate system with markedly less tropical warming than cycle 21 and 22. The southern Oscillation is now more La Nina dominant. The cooling at high latitudes is underway. It is reported that high northern latitudes are experiencing a degree of cold that has not been seen since the 1970’s. All this is due to a recovery in the strength of the polar vortex as the intensity of UV radiation and the pressure of the solar wind has fallen away. As a result equatorial temperature at 10hPa, 100hpa and 200hPa has declined reflecting diminishing ultraviolet radiation. The atmospheric parameters are now close to what they were prior to 1978 with the prospect of further adjustment to come if solar cycle 24 is weak, as seems likely.
Periodic and long term change in the distribution of the atmosphere wrought by the sun
The Earth has one equator and two poles. The cooling of the equatorial stratosphere depends upon vortex activity at both poles. Change at the poles at the time of the solstices is not synchronized. It seems reasonable to average 30hPa temperatures across the poles when assessing the impact of vortex activity on the single tropical stratosphere.
Figure 7 confirms that an increase in average 30hPa temperature at the poles coincides with troughs in tropical stratospheric temperature. The relationship is systematic. This supports the hypothesis that episodic shift in the atmosphere weakens the polar vortex while increasing the atmospheric depth over the equator causing a fall in stratospheric temperature there. As a result, the zone of maximum ozone concentration over the equator must shift vertically upwards in response to atmospheric thickening. The collapse in temperature at 30hPa relates to the ascent of this ozone rich zone. The zone of maximum ozone concentration and temperature is displaced upwards and downwards according to the dictates of the solar QBO. This observation has profound implications for climatology. It is particularly relevant to the study of oceanic oscillations, change in surface temperature and understanding the natural mechanisms for long term change in climate. Any notion that the Earths climate can be properly modelled without an appreciation of this dynamic is illusory.
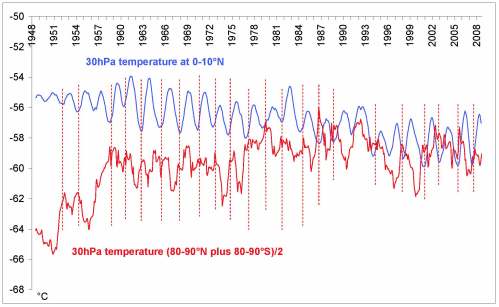
Fig. 7 Temperature increases at 30hPa in the polar stratosphere as it falls at 30hPa in the equatorial stratosphere
Temperature at the 100hPa level
The temperature at 100hPa is strongly influenced by the ozone reaction to long wave radiation from the Earth. At 100hPa the presence of ozone is due to a super-chilling process involved in equatorial convective decompression that makes the air drier. Ozone is soluble in water. In the industrial production of ozone it is necessary to chill the air to minus 80°C in order to dry it. A temperature of minus 80 to 85°C is regularly achieved at 100hPa above the equator. In this circumstance ozone is well conserved.
The response of temperature at 100hPa to the seasonal increase in surface temperature and long wave radiation in mid year is shown in figure 8. Temperature increases at the Lapse rate tropopause, the Cold Point tropopause and100hPa. It is also reflected in the water vapour saturation minimum. This response is due to a mid year peak in outgoing long wave radiation due to the heating of the northern hemisphere land masses and consequent 3% loss of global cloud cover (more in the northern hemisphere). This increase in temperature at 100hPa occurs at a time when surface and 500hPa temperature is at a seasonal minimum. Warm air is brought to the inter-tropical convergence by the north east trades giving rise to this seasonal peak in outgoing long wave radiation. OLR is therefore independent of surface temperature.
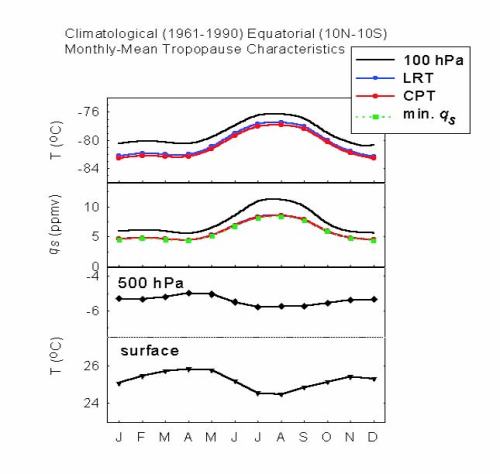
Fig. 8 Climatology of the tropopause
The following comment relates to the pattern of temperature change at 100hPa that is shown in figure 4. As solar activity ramped strongly after 1978 the rate of evaporation from the tropical oceans increased. The Earth and particularly the lower troposphere emitted more long-wave radiation. This promoted marked heating at 100hPa. This period of strong heating came to an end about 2005 and 100hPa temperature has since returned to pre 1978 levels. In the absence of further solar stimulus the tropical oceans should gradually cool. As 100hPa temperature falls it promotes ice cloud formation reflecting solar radiation and cooling the surface.
How far into the stratosphere does the reaction to outgoing long wave radiation that is evident at 100hPa extend? Ozone has been nominated as a greenhouse gas with respect to long wave infrared emissions from the Earth. It’s concentration at 100hPa is only 1-2 ppm by volume whereas the concentration of carbon dioxide in the atmosphere is 380 ppm by volume. A reactive gas absorbs radiation in a specific wave length and emits it at a different wave length, effectively scrubbing the absorbed wavelength from the spectrum of emissions. Ozone absorbs strongly at 9.6mm and 14mm. From the behaviour of the temperature curves in figure 2 it can be inferred that the infrared radiation from the Earth (in the specific wave lengths that excite ozone) is filtered out on first encounter with ozone in the upper troposphere and lower stratosphere. One would expect a similar layered filtering effect in relation to carbon dioxide depending upon the point of emission of OLR.
There is a lesson to be learned in relation to the posited greenhouse effect from the behaviour of temperature in the upper troposphere/lower stratosphere where OLR meets ozone. The energy gained at 100hPa due to the excitation of ozone by the Earths long wave radiation is not transmitted downwards. The outgoing long wave radiation peak at 100hPa occurs in August whereas the surface temperature peaks in May. (see figure 8 above) The May peak persists to the 200hPa level. The atmosphere itself therefore demonstrates that the posited downward transfer of energy does not occur. The countervailing force is the strength of convection. The greenhouse theorem is plainly unphysical.
Temperature change at the 200hPa level and ice cloud formation

Fig. 9 Temperature at 200hPa in the upper troposphere and at the surface
Figure 9 shows that the flux in 200hPa temperature is plainly much greater than temperature flux at the surface. The series that is superior produces the surface temperature trend. The trend is downward within the green squares. There is a broad region of the upper troposphere between 400hPa and 100hPa experiencing strong temperature fluctuations unrelated to surface conditions. This affects ice cloud density. Flux in ice cloud density is hard to measure and the cloud is extensive. It is nevertheless the main mechanism responsible for warming and cooling of the tropical oceans. ENSO is the Pacific manifestation of this process. The warming is never uniform because the distribution of ozone in the upper troposphere is not uniform and is forever changing. It is much influenced by the solar wind and the response of the solar wind to the Earths magnetic field.
The observations in this paper are supported by the work of Sukyoung Lee, David M. Shelow, Anne M. Thompson, Sonya K. Miller in a poster entitled SHADOZ Temperature and Ozone Anomalies Associated with QBO and ENSO The authors point out that:
1. The first two principal components of the ozone profiles from the SHADOZ (1998-2005) program are shown to be a viable QBO index.
2. The maximum tropospheric ozone anomalies associated with the QBO are ~ 8 ppbv, ie 10-20% that of typical tropospheric ozone values.
3. Temperature regression based on the inverted SOI confirms the tropospheric warming and stratospheric cooling associated with the ENSO.
Figure 10 records a long term decline in upper atmosphere relative humidity at the Equator and at 20-30°S. Plainly, cloud cover has suffered as relative humidity has fallen. Plainly, an increase in 200hPa temperature will produce clearing skies and warming seas. This pattern has intensified over the period of record.
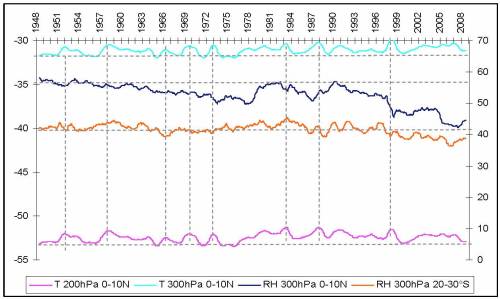
Fig. 10 Declining upper atmosphere relative humidity, especially in the tropics
Two very different hemispheres
Figure 11 shows the average temperature in each 10° latitude band between the poles. The southern hemisphere pole is much colder than the northern. This is reflected in temperature all the way from the surface to 10hPa. Why are the hemispheres so different?
The southern vortex weakens in summer but it never disappears. The northern vortex disappears in summer due to the heating of the northern land masses.
Secondly average global temperature is much warmer in July than January despite orbital influences that yield 7% stronger irradiance in January than in June. A low point in global cloud cover occurs in July and August at the peak of northern summer. A drying atmosphere accelerates the rate of warming of the northern hemisphere. There is marked volatility in 200hpa temperature across the Pacific in mid latitudes reflecting the influence of the Siberian downdraft that brings ozone into the troposphere. This ozone rich upper troposphere/lower stratosphere reacts strongly to change in ultraviolet light and outgoing long wave radiation. The above influence gives rise to strong warming in northern summer especially when the southern pole warms.
A similar dynamic drives sea surface temperature increase in southern summer that coincides with the collapse of the vortex over the Arctic.
Figure 11 also shows the affect of tropical moisture in diminishing ozone content and therefore temperature at 100hPa and to a lesser extent at 30hPa. Consequently temperature in the stratosphere at 100hPa and 30hPa tends to peak at about 45° north and south latitude. A warming tropical ocean produces a cooling tropical stratosphere.
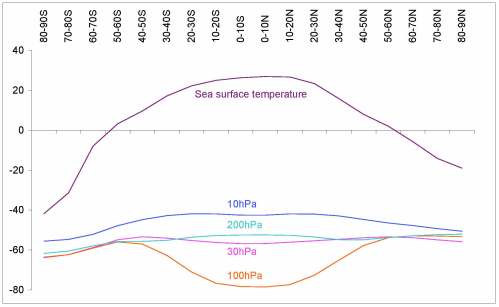
Fig. 11 Temperature °C according to latitude
Conclusion
Solar activity has weakened the vortex in both hemispheres. Periodic change in 200hPa temperature in response to changing ozone content and changing short wave radiation change ice cloud density and prevalence. This drives the Southern Oscillation. By and large it is the sea that stores energy and transports it to higher latitudes producing warmer winters. Ultimately sea surface temperature depends upon the Quasi Biennial Oscillation in ultraviolet radiation and the solar wind. The change in the solar QBO is responsible for the waxing and waning of the Southern Oscillation as it changes between El Nino and La Nina dominance.
Implications
Since warmer winters provide a longer growing season recent increase in winter temperature at high latitudes must be regarded as beneficial. That warming process is now reversing. If the sun descends into a deep minimum of ultraviolet and magnetic activity, all earth species will suffer.
The notion that carbon dioxide has caused a temperature increase is not supported by the climate record or observation of temperature dynamics beneath the tropopause. Limiting carbon emissions will do nothing to stem the course of solar driven climate change.
Modelling that begins with the assumption that influential parameters like ozone concentration, upper troposphere temperature and cloud cover are unaffected by solar activity, or that conditions in the troposphere are unaffected by QBO dynamics is devoid of value and has no utility whatsoever.
References:
QUASI-BIENNIAL OSCILLATIONS OF THE SOLAR MAGNETIC FIELDS E.V. Ivanov, V.N. Obridko, B.D. Shelting At: http://helios.izmiran.rssi.ru/hellab/Ivanov/papers%5C10.pdf
I.P.Gabis, O.A.Troshichev INFLUENCE OF VARIATIONS IN SOLAR UV IRRADIANCE ON QUASIBIENNIAL
OSCILLATIONS IN THE STRATOSPHERE AND ON ATMOSPHERIC CIRCULAT ION At: http://www.cosis.net/abstracts/COSPAR02/01724/COSPAR02-A-01724.pdf
Sukyoung Lee, David M. Shelow, Anne M. Thompson, Sonya K. Miller SHADOZ “Temperature and Ozone Anomalies Associated with QBO and ENSO ” At: http://www.atmosp.physics.utoronto.ca/SPARC/SPARC2008GA/Posters/SessionC_P54_A280_Lee_Sukyoung.pdf
Ruzmaikin, A., M. L. Santee, M. J. Schwartz, L. Froidevaux, and H. Pickett (2007), “The 27-day variations in stratospheric ozone and temperature: New MLS data”, Geophys. Res. Lett., 34, L02819, doi:10.1029/ 2006GL028419. At: http://mls.jpl.nasa.gov/joe/Ruzmaikin_2007.pdf
Excellent website compliments.

Stratcooling this spring
Is due to the deep minimum of the sun?
Thank you and excuse me for my english. Angelo Italy
By: angelo on April 7, 2009
at 6:25 am
Thank you Angelo for your compliment. I assure your your English is better than my Italian. If you look at the post “The atmosphere dancing in the solar wind” you will see a long discussion of the cause of that stratospheric warming in January-February which is now it seems getting back to cooler temperatures.
By: erlhapp on April 7, 2009
at 7:34 am
bonjour ,
excellent article , de très bonnes explications, agremantées de graphiques très explicites.
si vous avez le temps venez faire un tour sur notre site , on y parle aussi du soleil.
cordialement
By: Jaussaud on April 8, 2009
at 7:52 am
Jaussaud
Your site looks very interesting. Very well designed with great French flair. Only wish that I could read what is in there. But, With the help of Google Translate I have your message. Thank you for the kind comments.
By: erlhapp on April 8, 2009
at 9:20 am
This is what is missing in:
This is it!
By: Adolfo Giurfa on February 14, 2010
at 12:24 pm
I am sorry to admit that I don’t follow all of your thoughts. My grandpa lived through the dustbowl in Minnesota during the other depression the one in the 1930’s. He said the guy from the Government came buy and said they should plant trees on the fencelines. He seemed to think it was a good thing that they did it. The dust went away.
The earth just spinning around makes a huge amount of energy get absorbed by the atmosphere. Daytime it’s 90 nightime its 50.
It’s even worse in the exosphere. sometimes it’s 1500 C when there is no solar wind to blow the cosmic rays away.
Sometimes it’s only 500 C. Then the earths shadow.
What time of day are the readings taken? I have to take your data as valid as I don’t know procedure.
Anybodys argument that the relative humidity goes up 10% iin 5 years is valid even though in 1948 the only source of informatioin is a weather baloon they sent up once a year.
By: Nano on August 16, 2010
at 1:55 am