El Nino and the Southern Oscillation (ENSO) seems to be perceived as a change in the state of the tropical oceans, the focus being on the ENSO 3.4 region in the Pacific. It is thought that change in the Pacific feeds into temperature change elsewhere. The word ‘teleconnections’, is a mantra of climate science. It seems to be shorthand for “we know not how this happens but its regular’. There is also an opinion that ENSO change is temperature neutral on decadal and longer timescales.
I want to tip this perception of ENSO on its head. ENSO is the tropical manifestation of change in sea surface temperature that is most vigorous away from the equator. It is only when we look outside the 10°N to 10°S latitude band that we see the forces that create the phenomenon that we know as the El Nino Southern Oscillation.
A person unfamiliar with the way in which an automobile works might suggest that the turning of the wheels is responsible, via the ‘transmission’, for the up and down motion of the pistons. This is the case while the fuel supply is cut off but not so during acceleration. I assert that ‘wheels moving pistons’ is the mindset in relation to ENSO.
The end point of this essay is a realization that ENSO is not a tropical phenomenon at all. It is a driven by conditions at the poles, particularly Antarctica, and ultimately by the interaction between the mesosphere and the stratosphere.
All data is obtained from the very useful NCEP/NCAR reanalysis that is referenced as: Kalnay, E. and Coauthors, 1996: The NCEP/NCAR Reanalysis 40-year Project. Bull. Amer. Meteor. Soc., 77, 437-471. Thus data is available at http://www.cdc.noaa.gov/cgi-bin/data/timeseries/timeseries1.pl
In this work the average monthly temperature between January 1948 and August 2009 is computed. The difference between that average and the actual figure for each month is then obtained. That difference is referred to as an ‘anomaly’. What is shown here is therefore de-seasonalised data. It is de-seasonalised only in the sense that the method identifies change from the average for the entire period of record for this dataset. The anomaly thus calculated is occasionally presented as a five month running mean centred on the third month and this statistic is shown in the graphs as ‘5MMA’. This average is computed rather than relying on the function in Excel so as to preserve the integrity of the time axis. The figure is centred on the third month.
Sea surface temperature depends upon the stratosphere
Figure 1 shows the five month moving average of 20hPa temperature over Antarctica (in maroon) driving sea surface temperature (henceforth SST) in the Arctic (in blue). Relatively large changes in 20hpa temperature drive relatively large changes in sea surface temperature. Temperature in the stratosphere clearly leads the temperature at the sea surface. The lag is variable but it is of the order of a month or two and sometimes longer. The peak in 20hpa temperature occurs between September and November. I have confidence in asserting a strong causal relationship here. The mechanics of that causal relationship will be discussed later.
Fig 1
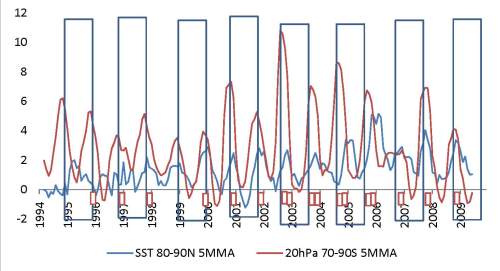
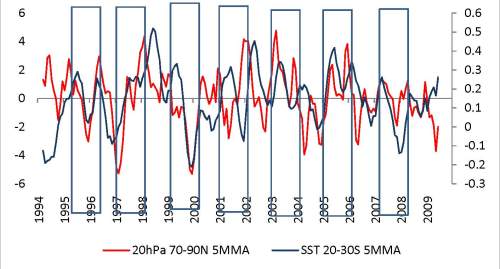
Figure 2 shows the five month moving average of 20hpa temperature in the Arctic stratosphere (in red) driving sea surface temperature in the 20-30°S latitude band (in blue). Here, smaller changes in 20hpa temperature drive minor changes in sea surface temperature with a range of about 1°C in the five month moving average (more on a monthly basis). The rhythm is not as regular, well defined or as consistent as in figure 1. There are good reasons for this that will become apparent. Clearly, the upper turning points in stratospheric temperature lead the upper turning points in sea surface temperature. Peaks in 20hpa temperature in the Arctic stratosphere occur between February and March. Occasionally a peak in 20hpa temperature occurs in mid year as in 1994, 1997, 2004 and 2006. This is likely an effect of the southern vortex which varies in strength in mid winter.
Fig 2
The questions that arise include: By what mechanism does the stratosphere drive surface temperature? If the Antarctic stratosphere drives Arctic sea surface temperature why does the Arctic stratosphere not drive SST in the Antarctic? What drives stratospheric temperature over the poles? Does change in temperature at the poles regulate the temperature of the stratosphere at lower latitudes. If so, how does this affect the flux of stratospheric and sea surface temperature at different latitudes?
First, let’s look at the way surface temperature varies at different latitudes. In the graphs that follow the vertical scale is the same in both hemispheres. The Northern hemisphere appears first and the same latitudes of the Southern hemisphere appear immediately below.
Fig 3
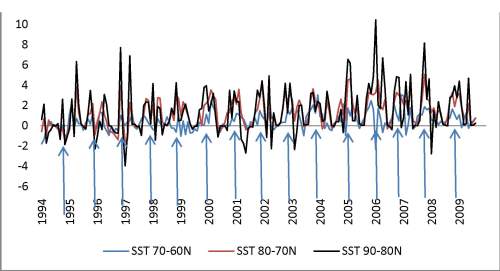
Fig 4
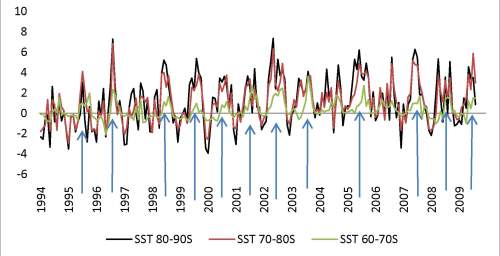
Comparing figures 3 and 4:
Marked SST increase occurred early in the period (1994 through to 1997) in both hemispheres. This generated the warmth for the El Nino of 1997-8. The ocean does not care where the warming occurs.
In general, the more sustained and bulky increases in SST over the widest latitude band occurred in the southern hemisphere in mid year.
The higher the latitude, the more extreme is the temperature fluctuation.
Fig 5
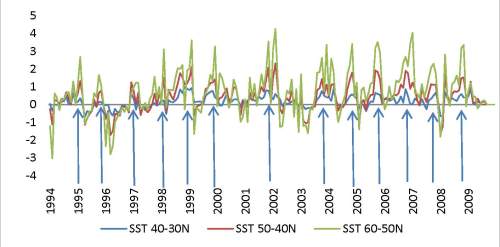
Fig 6
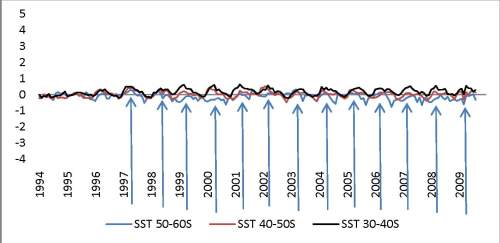
Comparing figures 5 and 6:
SST shows much more flux in the mid latitudes of the northern hemisphere than the southern.
Warm anomalies occur in December to January (winter) in the northern hemisphere.
In the southern hemisphere warm anomalies predominantly occur early in the year (summer) but the anomaly peak is later (during winter) at higher southern latitudes. The mid latitudes of the southern hemisphere are a transition point where a weak northern vortex competes with a strong and more persistent southern vortex in regulating stratospheric and sea surface temperature.
Fig 7
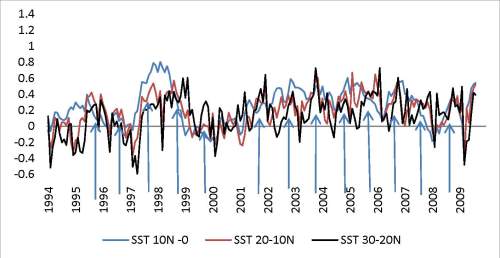
Fig 8
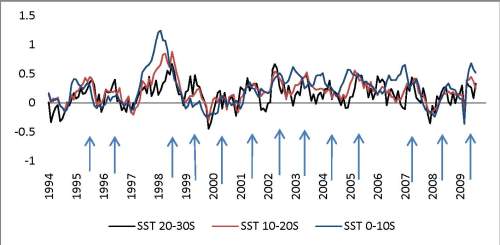
Comparing figures 7 and 8:
The most defined and seemingly erratic fluctuations (matching the pattern that prevails at higher latitudes) occur away from the equator at 20-30° latitude (in black)
The fluctuation of SST between equator and 10° south latitude is frequently out of sync with other southern latitudes occasionally peaking prior to year end like the SST of the northern tropics. This is likely due to the mixing of northern and southern waters.
The peaks of SST variation at the equator are much broader, rather amorphous and less well defined than at higher latitudes.
The equatorial fluctuation is atypical of other latitudes and is not a fair indication of the degree of warming of the sea globally.
Looking at the SST data as a whole
The most extreme variations in SST are at higher latitudes.
In mid latitudes the northern hemisphere shows much heavier fluctuations than the southern. The effect of the Arctic vortex on SST appears to be much diminished beyond about 30S latitude but these high latitude southern waters vary in temperature more than anywhere else on the globe. The variation here is in the middle of winter.
The seas in the two hemispheres experience peak warming activity at different times but these times are fairly consistent from year to year.
The only way in which the sea can warm simultaneously at all latitudes within a hemisphere is via a loss of cloud cover.
There is a unifying force dictating the pattern of sea surface temperature increase and this is the force that regulates stratospheric temperature.
What are these anomalies telling us about natural climate cycles?
The figure below shows the march of raw sea surface temperature in near equatorial latitudes. The strongest peak is in February-April while a secondary peak shows up in September to November in northern waters. A February-April peak is in the middle of the time of peak anomalies in SST in the Southern Hemisphere. The anomaly will be earlier if driven by the northern stratosphere and later if it is driven by the Antarctic stratosphere.
The secondary peak that shows up in September-November in the northern tropics is driven in part by the global reduction in cloud cover in northern summer and secondary effects from the state of the Antarctic (winter) vortex that shows strongly positive anomalies between September and December in the entire period after 1978.
The movement of southern water temperature prior to the strong El Nino of 1997-1998 shows how an expansive southern ocean can warm equatorial waters while the contribution from the restricted volume of northern hemisphere waters is relatively minor.
Fig 9 Sea surface temperature in close equatorial waters. Raw data.
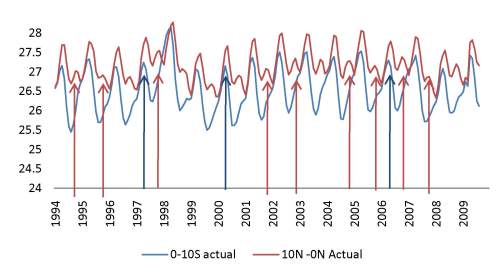
There is no other force than the sun that will warm the oceans in such an expansive fashion on this relatively rhythmic schedule. There is no chaos in this system. There is order and regulation. The largest sea surface temperature responses are at higher latitudes and the smallest responses are at low latitudes. This mirrors the pattern of temperature variation in the stratosphere.
What we witness in the period 1994-2009 is a simple amplification of the normal pattern of seasonal warming due to an amplification of stratospheric temperature.
Does change in temperature at the poles affect the stratosphere at lower latitudes and how does this affect the flux of temperature at different latitudes?
It is at the highest latitudes that 20hpa temperature fluctuates to the greatest extent. Figure 10 shows the primacy of stratospheric temperature change at the poles in relation to that at the equator. Vertical blue lines show precedence for polar temperature fluctuations. In the mixing process between poles and equator, ozone content and temperature fluctuations are damped. A further, little understood process tends to produce the quasi-biennial oscillation in ozone content, temperature and stratospheric wind that is apparent at 10°N to 10°S. In low latitudes the influx of moisture from overshooting convection erodes ozone because ozone is soluble in water. A further factor influencing conditions in the tropical stratosphere is the enigma of a rise in surface pressure at the equator during SST warming events accompanied by falling temperature at the highest levels of the equatorial stratosphere and a fall in surface pressure at the poles, the subject of my next post.
The unifying force that controls sea surface temperature is the changing concentration of ozone in the upper atmosphere. Change in ozone is a polar phenomenon because that is where the exchange with the mesosphere predominantly occurs.
Adding the anomaly of 20hPa temperature for the north and south accounts for a push pull relationship between the vortexes. Notice the decline in the summed anomalies from 1960 to 1976, a period when the seas cooled.
Fig 10
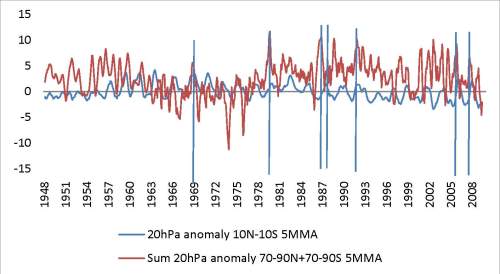
The question remains: Why does SST follow the temperature of the stratosphere.
This is a subject for speculation. My guess is that ice cloud in the atmosphere above 200hpa (where there is sufficient ozone and the rise and fall in temperature is consequently several times that at the surface), simply varies with temperature. As the upper air warms, relative humidity falls, less water is condensed as ice and consequently more sunlight gets through the atmosphere to reach the surface of the absorbing sea. It is the winter hemisphere vortex that determines the flux in ozone in the global stratosphere. It is in the summer hemisphere that the sun is shining on high latitudes.The relative weakness of the northern vortex vis a vis the southern means that it’s influence is weak beyond 30°S latitude. Between 30S latitude and Antarctica the southern vortex determines the issue.
It will not be easy to verify this hypothesis because the change in ice cloud density in the atmosphere above 200hpa is light and the change tiny.
Why bother? Why is it important to know how it works?
Fig 11
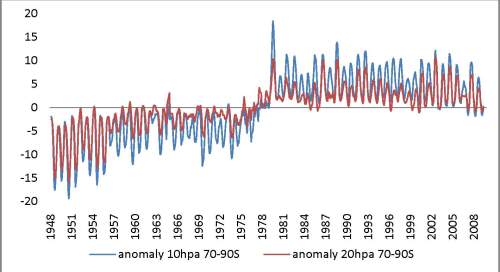
The Antarctic vortex exhibits the greatest change over the period of record. The origin of the climate shift of 1978 is apparent in figure 11. The greater change is at 10hpa indicating the influence of the mesosphere. The warming of the sea between 1978 and 2003 is wholly explicable. The sea warmed because the Antarctic stratosphere warmed. The documented cooling of the sea after 2003 has occurred because the Antarctic stratosphere began to cool about 2003.
In my next post I will look at inverse relationships between atmospheric pressure at the poles and the equator confirming that change in vortex strength lies behind the change in ozone and air temperature above the poles rather than the prevailing idea of ‘planetary waves’ generated by change in SST at the equator and the increase in convection that results from that. The latter is another instance where the wheels are seen to be causing the pistons to move up and down.
The warming and cooling of the globe is due to influences that have been in operation long before the industrial revolution and the burning of fossil fuels. The atmosphere is not capable of retaining warmth like a greenhouse. It is a very efficient vent for surface warmth. It should be compared to a collection of chimneys. Those who disagree with this assessment need to have a closer look at how the atmosphere functions.
A different view of ENSO and systematic climate change
Interesting reading Erl, I think there will be a day when our 2 area’s will come together. Scafetta has shown that there is correlations between the PDO and Solar velocity, your work and others is showing the importance of UV in the regulation of cloud cover and a possible driver of ENSO. And Svensmark of course has his lumbering giant. TSI may vary slightly and have some impact on ocean heat retention but perhaps a bigger player is the positive feedback that comes with the TSI variations. The Earth uses those positive feedbacks (cloud cover and ocean cycles) to further regulate the solar TSI, everything is solar related and I believe I have the answer for solar output. Us fellow Aussies should get together someday, I’m sure Archibald, yourself and myself could have an interesting discussion.
By: Geoff Sharp on October 4, 2009
at 11:36 am
Hi Geoff, thanks for taking an interest. Apologies for late reply. My work takes me into the fields and away from the internet.
This study has been a voyage of exploration for me. It is still going on. I am learning all the time. Although I did once imagine that changes in UV had implications for surface temperature I would say today that the effect is minor. Today I would say that the dominant cause of the flux in stratospheric temperature is due to the flux in ozone that begins and has its greatest amplitude at the poles. The temperature change from this source must be much greater than one would get from the flux in UV.
Critical thing to note is that the temperature of the stratosphere and the sea move together. And there are very long cycles. With good data from 1948 onwards amounting now to sixty years we are at the high point of a single cycle and still well short of completion. The cycles show up in atmospheric pressure and stratospheric temperature. That’s the next post.
By: erlhapp on October 9, 2009
at 11:56 am
Erl,
I have been reading several postings on your blog and I think your approach is most refreshing.
I will take some time to digest all your information and get back to you for any questions.
In the mean time, I sincerely hope we can stop our mad politicians and prevent a true disaster which threatens human kind if they succeed with their wicked plans.
Looking forward to your next publication,
With kind regards,
Ron de Haan
By: Ron de Haan on October 4, 2009
at 8:08 pm
Ron,
I see you quoting me to Leif at WUWT and to little avail. Thanks for trying. Pity Leif chooses to hide behind the statement that he is ‘having trouble making sense of what you write”.
I do go to great pains to make it as simple and direct as possible. Pity he will not even choose to discuss the implications of even just one figure.
The identity between SST and stratospheric temperature is plain as day. If one simply chooses to turn a blind eye to it there is not much one can do.
By: erlhapp on October 9, 2009
at 11:37 am
Hi Erl,
interesting stuff as always. One sentence which I’m interested in you expanding on a bit is this:
“The movement of southern water temperature prior to the strong El Nino of 1997-1998 shows how an expansive southern ocean can warm equatorial waters ”
What is the actual SST of the southern ocean compared to the 25.5-28C shown on your raw data equatorial graph at Fig. 9?
By: tallbloke on October 5, 2009
at 7:28 am
Tallbloke.
When I said: “The movement of southern water temperature prior to the strong El Nino of 1997-1998 shows how an expansive southern ocean can warm equatorial waters ”
I was referring to the jump in raw temperature data at 0-10S by comparison with the smaller jump at 0-10N.
Re: What is the actual SST of the southern ocean?
The NCEP/NCAR database will answer that question for you. Just put in the co-ordinates that you are interested in at http://www.cdc.noaa.gov/cgi-bin/data/timeseries/timeseries1.pl
The answer will vary by latitude and longitude.
Some of the largest variations occur in the infeed zone for Nino 1 and 2 off Chile at 20-30S lat. 250-280°E long. And this zone is a predictor for the equatorial latitudes.
By: erlhapp on October 9, 2009
at 11:28 am
Erl: How are you accounting for the annual variation in sea ice cover and its bias in your high-latitude SST anomaly data?
You list SST anomalies for 80S to 90S but there is no ocean there. There’s land mass and a couple of ice shelfs.
By: Bob Tisdale on October 6, 2009
at 12:11 pm
Hi Bob,
I simply take it for granted that the NCEP/NCAR data gives me what I ask for. I ask for sea surface and I guess its still sea even if its frozen. But, it had occurred to me that there is precious little sea in Antarctica and I am remiss in not following that up.
My material point is of course little affected by any discrepancies that may be in the database in iced up regions. My point is this: The data shows a symmetry in the warming from the near equatorial region through to the poles with the variation increasing with latitude. One could leave out the frozen areas and the point would be unimpaired. The increase in variation with latitude happens with stratospheric temperature as well. So, we have the wonderment of each latitude zone showing a heat spike at exactly the same time…….and I suggest that the only way that this can happen is by virtue of a change in cloud cover. And by virtue of the circulation of the ocean temperature change at any latitude will eventually show up as a variation at the equator.
So the change in the equatorial zone is a derived thing that very much depends upon what happens at higher latitudes. Change at the equator is not a true measure of what is happening at other latitudes. Nor does a focus on the equator help us at all when we look at the causes of ocean warming.
By: erlhapp on October 9, 2009
at 11:19 am
Erl: The other point you need to consider is the SST inaccuracies at high latitudes. During months with large amounts of floating ice, the readings are sparse. The dataset that infills the high latitudes best as far as I know is the OI.v2 SST data. Satellites correct for that bias. So if we look at the SST anomalies for three northern hemisphere bands (0-10N, 30N-40N, and 65N-75N)…


…and three southern hemisphere bands (10S-0, 40S-30S, and 75S-65S)…
…using OI.v2 SST anomalies that have been calculated against 1982 to 2009 means, the high latitudes no longer have the relationship you illustrate in your graphs.
Last, check your raw SST data at high latitudes. Verify that you aren’t seeing SSTs significantly below the freezing point of sea water. That’s one of the problems I discovered with the data you’re using.
By: Bob Tisdale on October 9, 2009
at 8:15 pm
Hi Bob,
Your data is all post 1980. If the base period for calculation of monthly means is different the graphs of monthly anomalies will be different. The pattern of temperature variation within the year is very different pre 1978 to post 1978. My means are calculated on the entire dataset from 1948 to 2009.
The collapse of the southern vortex from 1978 imposes a very different pattern of variation in monthly sea surface temperature. But you won’t see that if your dataset starts in 1980. Prior to 1978 there is a regularly repeating advance in Antarctic 10hPa temperature (and equatorial surface pressure) in March. After 1978 the advance is regularly in September and the amplitude is much greater. The September advance yields late year SST warming yielding an El Nino bias to equatorial temperature. That’s the basis of the 30 year warming trend.
Amplification of September October and November anomaly data is also seen in the post 1998 aa index of geomagnetic activity.
This pattern is also seen in the change in surface pressure between the Antarctic (decreasing) and the equator (increasing). That change in pressure is in conformity with what I am saying about the role of the vortexes in driving stratospheric ozone content, upper atmosphere temperature, cloud cover and surface irradiation.
None of this will be apparent if the data you are using starts in 1980.
Have you raised your queries about the validity of their SST data with NCEP/NCAR? I don’t think I am in a position to answer for them. I see no problem with SST below the freezing point of water. The sea is liquid or the sea is ice.
By: erlhapp on October 10, 2009
at 1:18 pm
Erl: You replied, “Your data is all post 1980. If the base period for calculation of monthly means is different the graphs of monthly anomalies will be different. The pattern of temperature variation within the year is very different pre 1978 to post 1978. My means are calculated on the entire dataset from 1948 to 2009.”
So let’s look at the three northern hemisphere bands (0-10N, 30N-40N, and 65N-75N)…


…and three southern hemisphere bands (10S-0, 40S-30S, and 75S-65S)…
…using HADISST SST anomalies that have been calculated against 1948 to 2009 means. Again the high latitudes no longer have the relationship you illustrate in your graphs.
To illustrate one of the problems with the ESRL website you’re using as a source of data, here’s the ESRL SST anomalies graph of 15N-25N, 0-30E:

Unfortunately, there’s no ocean there. The ESRL is providing SST anomaly data for the Sahara Desert, Erl.
You may be on to something, but your data source is extreeeeeeeeeemely suspect. Maybe you should find another data source.
By: Bob Tisdale on October 12, 2009
at 10:24 am
Hi Bob,
I had a brief look at the HADISST site and looks to me like they don’t want to make it easy for people to access data. Would it be possible for you to email me the data for a a mid latitude and a high latitude 10 degree band so that I can check out the differences?
By: erlhapp on October 21, 2009
at 2:14 am
This is awesome, turns everything 180º
By: Robert Read on August 17, 2010
at 5:04 pm
Thanks for the comment Robert. I have looked at the matter anew in terms of the flux in surface pressure. See: Is ENSO, rather than a ‘Greenhouse Effect’, the origin of ‘Climate Change’
Erl Happ Happs Pty Ltd 575 Commonage Rd. Dunsborough Australia 6281 Phone 61(0)8 9755 3300 Facsimile 61(0)8 9755 3846 W: http://www.happs.com.au/ E: happs@happs.com.au
By: Erl Happ on August 17, 2010
at 7:30 pm