W.14_Lilly Wasitova_Price Changes and Inflation Rates


Problem Statement


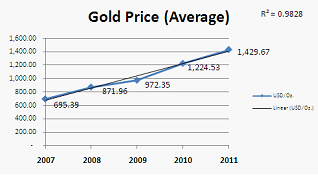
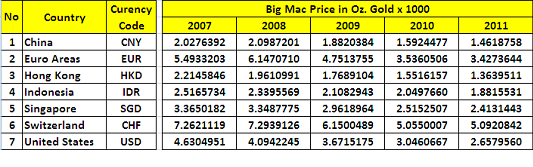
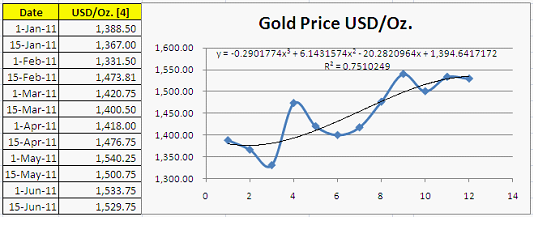
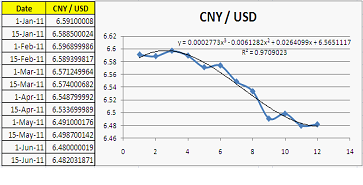
Using the data already analyzed in my previous blogs, a study on the price increments over the 5 years period of time from 2007 to 2011 for the Big Mac™ Price based on US Dollar from [6] and the Gold Price from [4], as we can see it in the below table:


Table 1 : Big Mac™ Price [6] and Gold Price [4] from 2007 to 2011


Alternative Solutions


As we know that price increments over the time usually caused by the inflation, which according to [11] means “the ongoing fall in the overall purchasing power of the monetary unit” and according to [1] can affect the economic comparison of alternatives. With the Monthly Inflation Rate from [10], taken from the US CPI (Consumer Price Index) we can retrieve the data for the year 2006 to present in Table 2, as below:


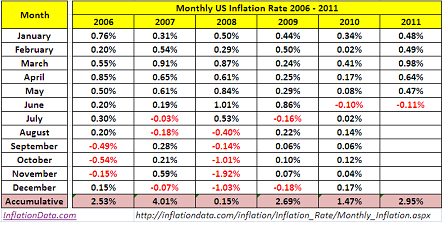
Table 2 :Monthly Inflation Rate [10] from 2006 to 2011


The plotted Inflation Rate with its control chart is in Figure 1 :


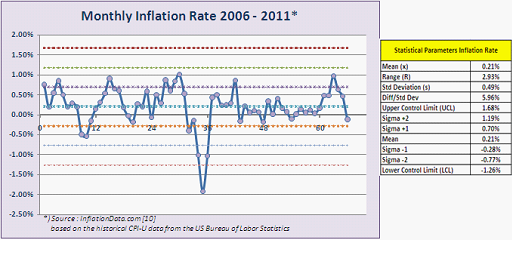
Figure 1 : The Monthly Inflation Rate [10] and its Control Chart from 2006 to 2011


Selection Criteria


The selection criteria will be:

  • Using the data period from the year 2006 to 2011 for the Inflation Rate (accumulative per year) and from 2007 to 2011 for the Big Mac Price and Gold Price, using average values for price of selected data.
  • Calculate the Real Dollar (R$) based on the Big Mac™ Price, Gold Price and US Inflation Rate (f) for all selected Countries/Area.
  • Compare the result with the Actual Dollar (A$) and the actual price changes


Analysis and Comparison of Alternatives


The Real Dollar calculation is following the formula from [1]:


Where :             R$ = Real Dollar

A$ = Actual Dollar

k = Time Period

b = Base Time Period

f = Inflation Rate (yearly rate)


Gives us the following result:


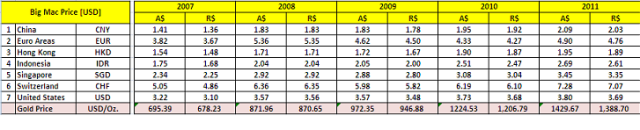
Table 3 : Calculated Real Dollars R$ for the Big Mac™ Price [6] and Gold Price [4] from 2007 to 2011


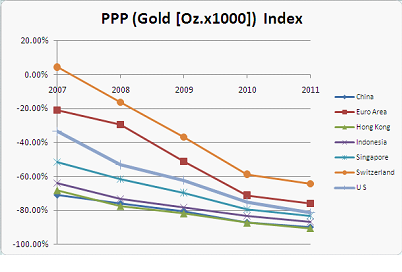
To compare the result with the actual price changes in percent, as we can see below is showing negative values that indicates a price decrease as an impact of the Global Economic Recession in 2007 – 2008. The baseline year is the year 2007 and the increments are calculated on yearly basis.

:

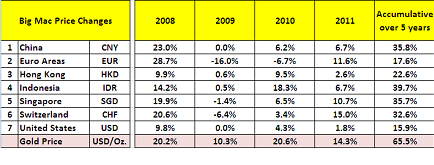
Table 4 : Changes of the Big Mac™ Price [6] and Gold Price [4] from 2007 to 2011


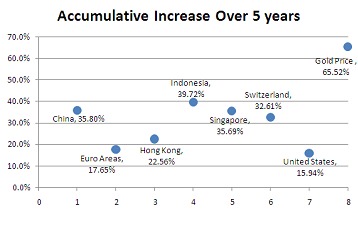
Figure 2 : Accumulative Increase of the Big Mac Price and Gold Price from 2007 to 2011


Selection of the preferred alternatives


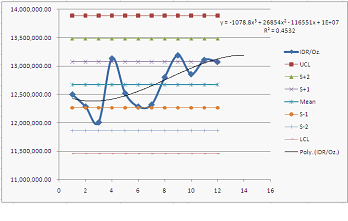
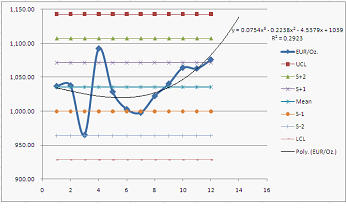
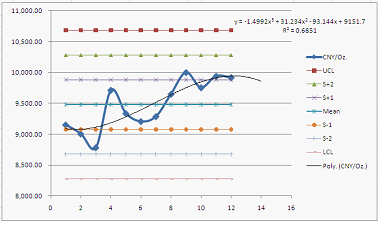
The absolute values for the price difference and calculated Real Dollar are listed in Table 5 and Table 6 and the accumulative difference over 5 years are plotted and compared in Figure 3 below.


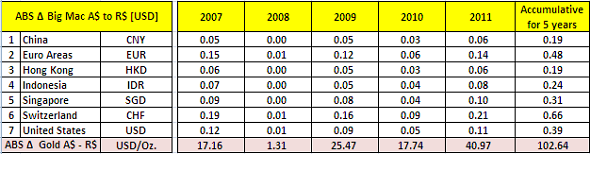
Table 5 :The Absolute Big Mac™ and Gold Price Difference between Actual $ and Real Dollar Year 2007 to 2011


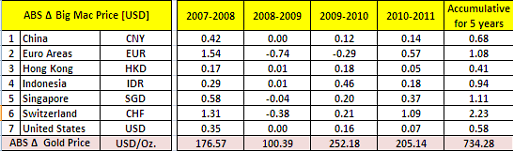
Table 6 : The Big Mac™ and Gold Price Difference from Year 2007 to 2011


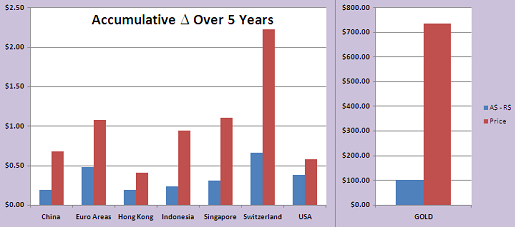
Figure3 : The Accumulative Difference Over 5 Years for Big Mac™ and Gold from Year 2007 to 2011


Performance Monitoring & Post Evaluation of Results

From the above calculation and analysis, we can say that:

  1. The Monthly Inflation Rate between the Years 2006 to 2011 is out of control, since one point fall outside the control limit, namely in November 2008 with -1.91%. Even though the accumulative yearly rate for 2008 was kept slightly positive, but the actual recession impact can be seen here, since the highest inflation rate is also in the same year with 1.01% in June 2008 and there are two points for October and December 2008 that are in Zone A to LCL. In general, the inflation rate in 2008 is out of control.
  2. The Real Dollar Calculation considering the inflation rate for the Big Mac™ Price in absolute value has actually no significant impact, if only we calculate for the consumer needs, compared to the actual price change.
  3. The Big Mac™ actual relative price changes for other Countries/Area than United States are much higher than the United States, due to the fact that that Counties/Area have different inflation rate, which is not under consideration here.
  4. The accumulative Big Mac™ Price change for United States over 5 years period is 15.94%, is still higher than the accumulative inflation rate for 5 years of 11.27%. This may happen due to the profit and services cost component.
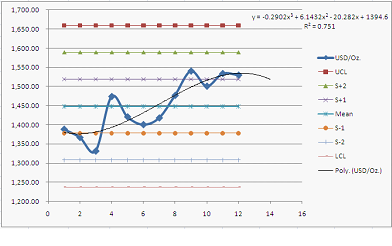
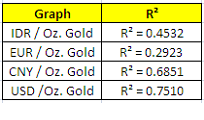
  5. The Inflation Rate has less impact on the increase of The Gold Price.


References:

  1. Sullivan, William G., Wicks, Elin M. & Koelling, C. Patrick (1942), Engineering Economy 15th Edition, Singapore: Prentice Hall, Inc.
  2. Michael Bassard & Diane Riter (2010), The Memory Jogger 2nd Edition, Canada, GOAL/QPC
  3. XE, The World’s Favorite Currency Site http://www.xe.com/ucc/
  4. KITCO http://www.kitco.com/scripts/hist_charts/yearly_graphs.plx
  5. John K. Hollmann, PE CCE (2006), Total Cost Management Framework, A Process for Applying the Skills and Knowledge of Cost Engineering 1st Edition, USA, AACE International – The Association for the Advancement of Cost Engineering
  6. The Economist, http://www.economist.com/node/12991434?story_id=E1_TNJJTQPQ
  7. Michael R. Pakko and Patricia S. Pollard (2003), Burgernomics: A Big Mac™ Guide to Purchasing Power Parity, The Federal Reserve Bank of St. Louis
  8. International Monetary Fund (April 2009), World Economic Outlook – Crisis and Recovery, IMF Multimedia Services Division
  9. Chronology: Financial Crisis Spreads From US to World Markets (October 4th, 2008),
Posted in Lilly Wasitova, Week #14 | 2 Comments

W.13_Lilly Wasitova_The Purchasing Power Parity


Problem Statement


To follow up on my blog # 12 regarding the Big Mac™ Index, it is time to look deeper into the theory of Purchasing Power Parity (PPP), since the PPP has been using US Dollar as the reference to determine the relative values of currencies, especially during the Global Economic Recession which has affected the United States the most. The Global Economic Recession started in 2007 and stabilized somehow in late 2008 to mid 2009.


To example to be used here is the price of Big Mac™ from [6] in seven selected different Counties/Area from the year 2007 to 2011, as below:


Table 1 : Big Mac™ Price [6] from 2007 to 2011


The Country/Area Selection is based on the highest and lowest price and the most stable countries during the recession, according to the IMF report [8]


Alternative Solutions


The Purchasing Power Parity Theory, which is one of the foundations of international economics, is stating that the price levels in any two countries should be identical after converting prices into a common currency [7]. So far all indexes are calculated by using the US Dollar as reference and if we take the prices from Table 1 and plot them in the below Graph, it is showing a non-linear lines for all Countries/Area and certain instability of increments over the period from 2007 – 2011.


Figure 1 : The Big Mac Price from 2007 to 2011


Taking the average Gold Price USD/Oz. from [4] from the year 2007 – 2011, with an almost linear increase as indicated by the linear trend line with R2 coefficient of 0.9828 as shown below, we can calculate the Index based on the Gold Price.


Figure 2 : The Gold Price [4] from 2007 to 2011 with trend-line


Selection Criteria


The selection criteria will be:

  • Using the data period from the year 2007 to 2011, using average values for all selected data.
  • Calculate the Index based on the Gold Price for all selected Countries/Area.
  • Compare the Indexes between the US Dollar based and the Gold based


Analysis and Comparison of Alternatives


The calculation of the Big Mac™ Price from US Dollar to Gold is given in the below Table:


Table 2 : The Big Mac™ Price in Gold [Oz. x 1000]


The R2 Coefficient for the Chinese Yuan [CNY] is the worse, since the graph is almost flat compared to others, whereas the US Dollar is on zero line as reference line for Over or Undervalue of the currencies.


Selection of the preferred alternatives


Plotting the Big Mac™ Index from [6] from year 2007 to 2011, as compiled in the below Table and shown in Figure 3, we can see that all Indexes showing an increasing trend from 2010, except for Hong Kong, which is showing a flat trend. This indicator was used as one of the argument that the global recession is already recovered in 2010.


Table 3 : The Big Mac™ Index [6] from Year 2007 to 2011


Figure 3 : The Big Mac™ Index [6] from Year 2007 to 2011


When we take the figures in Table 2., and calculate the Purchasing Power Parity Index based on Gold Price, we can see the result in the below Table and plotted in Figure 4:


Table 4 : Calculated PPP Index using Gold as Base from Year 2007 to 2011


Figure 4 : Calculated PPP Index using Gold as Base from Year 2007 to 2011


Comparing the trends in Figure 3 and Figure 4, we can see that

  1. In Figure 3 between Year 2008 and 2010, the recession only affecting overvalued Country/Area, in this case Euro Are and Switzerland, by having a declining Indexes, whereas all Undervalued Countries still having I slight increased Indexes.
  2. In Figure 4, all Countries/Area having a declining trend and all are Undervalued, except for Switzerland in 2007 with still positive Index Value. Between 2008 -2010, the declining Gradient is so showing a ‘nosedive’ trend especially for Switzerland, Euro Area and USA and after wards they are showing a slight slope only.


Performance Monitoring & Post Evaluation of Results

From the above calculation and above analysis, we can say that:

  1. The fact that the Global Economic Recession has an impact to all selected Countries here, but the impact of the recession mostly hit the US Dollar and as we can see from the declining trends also the Euro Area and Switzerland CHF.
  2. The Gold Price at the other hand is showing constant increase over the period of time and accumulatively over the period of 5 years, the increase is 65.5%
  3. The Big Mac™ price converted into Gold [Oz.x1000] is showing a reduced price over the time
  4. Taking the Big Mac Index and convert the values to Gold Price is saying that the US Dollar has a different behavior and cannot be seen as the stable reference for the Index.
  5. Comparing the PPP of Big Mac™ Index with the PPP of Gold [Oz.x1000] is seen that a contrary trends and behavior between the two Indexes, especially for the classification of under- and Overvalued.


References:

  1. Sullivan, William G., Wicks, Elin M. & Koelling, C. Patrick (1942), Engineering Economy 15th Edition, Singapore: Prentice Hall, Inc.
  2. Michael Bassard & Diane Riter (2010), The Memory Jogger 2nd Edition, Canada, GOAL/QPC
  3. XE, The World’s Favorite Currency Site http://www.xe.com/ucc/
  4. KITCO http://www.kitco.com/scripts/hist_charts/yearly_graphs.plx
  5. John K. Hollmann, PE CCE (2006), Total Cost Management Framework, A Process for Applying the Skills and Knowledge of Cost Engineering 1st Edition, USA, AACE International – The Association for the Advancement of Cost Engineering
  6. The Economist, http://www.economist.com/node/12991434?story_id=E1_TNJJTQPQ
  7. Michael R. Pakko and Patricia S. Pollard (2003), Burgernomics: A Big Mac™ Guide to Purchasing Power Parity, The Federal Reserve Bank of St. Louis
  8. International Monetary Fund (April 2009), World Economic Outlook – Crisis and Recovery, IMF Multimedia Services Division
Posted in Lilly Wasitova, Week #13 | 1 Comment

W16_Candra Nugraha_Sensitivity Analysis


Opportunity Statements

Project Proposal should consist of the feasibility studies which include technical concepts, budgetary and the most important thing is the economic calculation. One of my job functions is to evaluate the options and come up with recommendation by considering sensitivity analysis

This Compressor station will be developed due to gas sales opportunity to public electrical  company for their Gas Turbine Generators. This analysis will give us the idea of economic limit of the project.

Root Cause

  • The uncertainty of gas price against the capital investment, operating expense as well as proven certification reserve.
  • The Compressor Package shall fulfill the technical requirements as Basis of Design and economically feasible based on the capital investment, operating expense and revenue generated.

Develop Alternatives

Table below is showing Production Profile for 5 years service life, forecast of investment, opex and method of depreciation.

How do we know the sensitivity against gas price (from US$4.5 – 6 /MBTU), NPV@10%, IRR, capex and opex ? The table below is showing calculation of those parameters.


Development of the outcomes

The graph below is indication of sensitivity analysis:


Minimum Acceptable requirements

The criteria of economic selection are:

  • The Highest Net Income for Government.
  • Life Time for 5 years.
  • NPV calculated at 10% Discount.
  • Cost Depreciation is applied for Double Declining Balance which is 5 years for production facility.

Analyze and compare the alternatives

Based on the alternatives as given, we come up with the preliminary economic calculation based on the sensitivity analysis US$4.5 /MBTU gas price for the given surface facility investment:

The projected cost for compressor station for US$3.1 million is still acceptable for the worst case gas price US$4.5 /MBTU.

Develop preferred alternative

Gas Compressor Station for US$3.1 million , is this worth Doing?

Estimated revenue generated at NPV10% for Government Take is US$3.247 million for 5 years operation. The Pay Out Time is 2.83 years with IRR17.62%.

The following summaries the information considered before it made as Go or No Go Decision:

Monitor and Evaluation (Post Mortem)

After the Authorization for Expenditure (AFE) is approved, the following Success Planning is monitored and shall be achieved.

Success Metrics

  • Spills – zero.
  • Industrial Accident / LTI  – zero.
  • Cost performance – +/- 10% of budget.
  • Schedule performance – +/- 10% of milestone dates.

Success Factor

The following action items are a must for achieving the Success Metrics above:

  • Good team work & coordination – meet on regular basis, good cross functional participation and good team commitment.
  • Follow the project management practices.
  • Follow HES procedures and approved standards & codes.
  • Utilize VIP’s & Best Practices.
  • Involve the right resources (e.g., contract development).

References:

  • Peters, Max S & Timmerhaus, Klaus D. (1991), Plant Design and Economics for Chemical Engineers 4th Edition, Singapore: McGraw-Hill, Inc.
  • Sullivan, William G., Wicks, Elin M. & Koelling, C. Patrick (1942), Engineering Economy 15th Edition, Singapore: Prentice Hall, Inc.
Posted in Candra Nugraha, Week #16 | 1 Comment

W15_Candra Nugraha_Cementing Job


Opportunity Statements

Due to increasing demand for the wells work over, cementing jobs are required to perform squeezing existing formation and open new layer for oil and gas production. This field is producing about 7000 bopd by using 4 Rig/Hoist existing to serve 46 jobs per year.

As we need to accelerate oil production to achieve target by the end of year 2011, it’s about 140 old wells will be reactivated. The scenarios to provide the cementing equipments are described below.

Root Cause

  • To anticipate additional jobs for 3 unit rigs, one cementing tank is required to perform squeezing well  formation.
  • Cementing Pump, Mud Agitator and power supply should be available as well without disturbing current 4 Rig/Hoist existing.

Develop Alternatives

Three options are available to support current opportunities.

Development of the outcomes

The Force Field Analysis is developed as per below:


Minimum Acceptable requirements

The criteria of economic selection are:

  • The Highest Net Cash Flow and NPV.
  • Life Time is predicted for 5 years.
  • NPV calculated at 10% Discount.

Develop preferred alternative

Scenario: Invest new cementing unit, is this worth Doing?

Estimated revenue generated as calculated NPV@10% is US$4.927.022 for 5 years operation.

Pay out Time is 3.5 months.

Monitor and Evaluation (Post Mortem)

After the Authorization for Expenditure (AFE) is approved, the following Success Planning is monitored and shall be achieved.

Success Metrics

  • Spills – zero.
  • Industrial Accident / LTI  – zero.
  • Cost performance – +/- 10% of budget.
  • Schedule performance – +/- 10% of milestone dates.

Success Factor

The following action items are a must for achieving the Success Metrics above:

  • Good team work & coordination – meet on regular basis, good cross functional participation and good team commitment.
  • Follow the project management practices.
  • Follow HES procedures and approved standards & codes.
  • Utilize VIP’s & Best Practices.
  • Involve the right resources (e.g., contract development).

References:

  1. Peters, Max S & Timmerhaus, Klaus D. (1991), Plant Design and Economics for Chemical Engineers 4th Edition, Singapore: McGraw-Hill, Inc.
  2. Sullivan, William G., Wicks, Elin M. & Koelling, C. Patrick (1942), Engineering Economy 15th Edition, Singapore: Prentice Hall, Inc.
Posted in Candra Nugraha, Week #15 | 1 Comment

W.12_Lilly Wasitova_The Big Mac Index


Problem Statement


To follow up on my blog # 11 regarding the study of Gold Price vs. Exchange Rate, it is interesting to consider the theory of Purchasing Power Parity (PPP) into the picture, since the PPP has been using US Dollar as the reference to determine the relative values of currencies.


As The Economist [6] has introduced the most famous example of PPP by using the Big Mac Index to be used as an index to determine the relative value of other items, the study here will be using the Big Mac Index from [6] from 7 (seven) different currencies and the average Gold Price from [4] from the year 2007 to 2011.


Table 1 : Big Mac Index [6] and Gold Price [4] from 2007 to 2011


Alternative Solutions


The Big Mac Indexes shown in the below Graph are showing an increasing value for the past two years and the highest index is for Switzerland [CHF] whereas the lowest is for Hong Kong [HKD]. The trend line used is the 3rd Grade Polynomial Trend Line, as it was already used in the previous studies.


Figure 1 : The Big Mac Index from 2007 to 2011


As a comparison is the Graph of the Gold Price USD/Oz. from the same period and showing an increasing trend from the beginning as below:


Figure 2 : The Gold Price [4] from 2007 to 2011 with trend-lines


Selection Criteria


The selection criteria will be the same for all approaches, namely:

  • Data period from the year 2007 to 2011, using average values.
  • The 3rd Order Polynomial Trend Line and R2 coefficient
  • To convert the Big Mac Price to Ounce of Gold and see the trends


Analysis and Comparison of Alternatives


To compare the input data and graphs, the R2 coefficient comparison for the all Big Mac Indexes are very acceptable as well as the Gold Price Coefficient, as shown in the below table:


Table 2 : R2 coefficient Result for Big Mac Indexes and Gold Price


The R2 Coefficient for the Chinese Yuan [CNY] is the worse, since the graph is almost flat compared to others, whereas the US Dollar is on zero line as reference line for Over or Undervalue of the currencies.


Selection of the preferred alternatives


Converting the Big Mac Price to Ounce of Gold to see gives us the below table and graph:


Table 3 : Big Mac Price in Ounce of Gold, using average Gold Price USD/Oz.


Figure 3 : Big Mac Prices in Ounce of Gold, using average Gold Price USD/Oz. and their trend lines


Table 4 : R2 coefficient Result for Big Mac Prices in Oz of Gold


Comparing the trends in Figure 3 and the R2 Coefficients in Table 4, we can see that

  1. The Big Mac Price for USA [USD] is no longer in zero line
  2. For the next Period there are only three inclining trend lines namely for Switzerland [CH], Euro Based Countries [EUR] and Singapore [SGD]
  3. For the next Period there are three declining trend lines for Indonesia [IDR], Hong Kong [HKD] and China [CNY]
  4. Perfect R2 Coefficient for Big Mac Price in Gold for China [CNY] R2 = 1, compared to the worse in its Big Mac Index
  5. All other R2 Coefficient are very acceptable, close to perfect trend.


Performance Monitoring & Post Evaluation of Results

From the above calculation and above analysis, we can say that:

  1. To make the common approach of the 3rd Order Polynomial Tend Line to all set of selected data is the right approach and giving the very acceptable values.
  2. Taking the Big Mac Index and convert the values to Gold Price is saying that the US Dollar has a different behavior and cannot be seen as the stable reference for the Index.
  3. With the Gold Price reference, the trends vary for different currencies, and behave differently than if only considering the Big Mac Index as the Purchasing Power Parity application.


References:

  1. Sullivan, William G., Wicks, Elin M. & Koelling, C. Patrick (1942), Engineering Economy 15th Edition, Singapore: Prentice Hall, Inc.
  2. Michael Bassard & Diane Riter (2010), The Memory Jogger 2nd Edition, Canada, GOAL/QPC
  3. XE, The World’s Favorite Currency Site http://www.xe.com/ucc/
  4. KITCO http://www.kitco.com/scripts/hist_charts/yearly_graphs.plx
  5. John K. Hollmann, PE CCE (2006), Total Cost Management Framework, A Process for Applying the Skills and Knowledge of Cost Engineering 1st Edition, USA, AACE International – The Association for the Advancement of Cost Engineering
  6. The Economist, http://www.economist.com/node/12991434?story_id=E1_TNJJTQPQ


Posted in Lilly Wasitova, Week #12 | 2 Comments

W.11_Lilly Wasitova_Gold Price vs. Exchange Rate


Problem Statement


To follow up on my blog # 8 regarding the study of Gold Price as Stable Reference Value, it is interesting to make further study on how this value correlates with the dynamic Exchange Rate of some currencies of interests in the same selected period of time.


The result from previous blog will be used here as reference, including the previously selected trend line. However, this study will be limited to the graph of the 1st Semester of 2011 using the data from [4], as below:


Figure 1 : Gold Price in the 1st Semester of 2011 [4], with trend-line


Alternative Solutions


As comparison in the same time period, below are the currency exchanges of Indonesian Rupiah [IDR], European Euro [EUR] and Chinese Yuan Renminbi [CNY] to the American Dollar [USD] from [3]:


Figure 2a-c : The Exchange Rates of IDR, EUR and CNY to USD in the 1st Semester of 2011 [3] with trend-lines


Selection Criteria


The selection criteria will be the same for all approaches, namely:

  • Data period from January 1st to June 15th 2011
  • The 3rd Order Polynomial Trend Line and R2 coefficient
  • The use of Statistical Process Control


Analysis and Comparison of Alternatives


To compare the input data and graphs, the R2 coefficient comparison for the exchange rates of IDR/USD and CNY/USD are very acceptable and the exchange rate of EUR/USD is still not as good as the other two but still acceptable, whereas the USD/Oz Gold is only passable due to very huge fluctuation, as shown in the below table:


Table 1 : R2 coefficient Result


To be noted here is the R2 coefficient
for the USD/Oz. Gold already changed to worse from previous blog, since the data used is limited from January 1st to June 15th, 2011.


All Exchange rates show declining graph with a trend to get better in the near future, where at the other hand the Gold Price USD /OZ. is showing a fluctuating increase with a trend to decline in the near future.


Using the Gold price in Figure 1 converted to each currency in Figure 2 gives us the following table and graphs:


Table 2 : Gold Price in Different Currencies and Their Statistical Parameters


Figure 3 : Control Chart for Gold Price USD/Oz.


Figure 4a-c : Control Charts for Gold Price IDR/Oz., EUR/Oz. and CNY/Oz.


Selection of the preferred alternatives


Converting the Price of Gold to the selected exchange rates and plotting their 3rd Grade Polynomial Trend Lines gives us the R2 coefficient as per Table 3 and it is showing that the values are not acceptable even for the CNY/Oz. Gold is not coming closer to the reference value of USD/Oz. Gold.


Table 3 : R2 coefficient Result for Price of Gold of Different Currencies

Comparing the trends for Gold Values in 4 different currencies, only 2 currencies are showing the same trend as the reference of USD/Oz. Gold yet not in the same gradient. Very surprising is to see the exponential increasing trend for the EUR / Oz. Gold (with also the worse R2 coefficient).


Performance Monitoring & Post Evaluation of Results

From the above calculation and above analysis, we can say that:

  1. To make the common approach of the 3rd Order Polynomial Tend Line to all set of selected data may not be the right approach, since the results vary too much.
  2. Using [2] to analyze the control charts giving the result that statistically all processes described in the graphs are pretty much under control. However if further investigation is made, the question of “Did the samples come from different parts of the process” will be answered by “Yes” and this may cause the different trends for the gold price with different currencies.
  3. The currently increasing gold price is still not to be taken as reference, if it comes to multi currencies trade, since the different government policies to control their economy will supersede the gold market situation.


References:

  1. Sullivan, William G., Wicks, Elin M. & Koelling, C. Patrick (1942), Engineering Economy 15th Edition, Singapore: Prentice Hall, Inc.
  2. Michael Bassard & Diane Riter (2010), The Memory Jogger 2nd Edition, Canada, GOAL/QPC
  3. XE, The World’s Favorite Currency Site http://www.xe.com/ucc/
  4. KITCO http://www.kitco.com/scripts/hist_charts/yearly_graphs.plx
  5. John K. Hollmann, PE CCE (2006), Total Cost Management Framework, A Process for Applying the Skills and Knowledge of Cost Engineering 1st Edition, USA, AACE International – The Association for the Advancement of Cost Engineering
Posted in Lilly Wasitova, Week #11 | 6 Comments

W.12 – David King – Immigration Games


Problem Recognition, Definition, and Evaluation

On Tuesday I’ll be travelling to the states to attend my sister’s wedding. While on my trip to the States, my KITAS will expire. This brings up the question on how to handle my current living situation.

Development of the feasible alternatives

  1. No longer live in Indonesia
  2. Return to Indonesia on a tourist visa
  3. Renew my KITAS while in Los Angeles
  4. Renew my KITAS by making an additional trip to Singapore before returning to Jakarta

Development of cost for feasible alternatives

  1. If I no longer live in Indonesia, that will force me to move home to Las Vegas. Odds are I would have to stay with my sister while starting over. Due to a 10% reported unemployment, realistic is 20% unemployment and most jobs are service based it will be difficult to find employment there. As well my expenses for staying there will be triple my current expenses here.
  2. If I return to Indonesia on a tourist visa it will only cost me $25 to arrive. However, let’s assume I’ll stay here for one year. That means I need to leave the country every 30 days. The cheapest way to do that is to fly to Singapore every month. The average flight to Singapore is about $100 and the Jakarta airport also has an exit tax of $17.65. The total comes out to an expense of $1711.76 cents for the year.
  3. If I do my KITAS while in Los Angeles, I must immediately return within in a week of the telex being sent to Los Angeles. This will force me to complete this task at the end of my trip. This will also force me to make an additional return trip to Los Angeles. The entire duration of the trip will take 6 days. Since Los Angeles is a large town it will cost the price of two plane tickets at $100, 6 nights hotel at $150 per night, and 6 nights of vehicle rental at $50 a day and $500 to process the paperwork. The total cost of this option is $1900.
  4. If I do the KITAS in Singapore, I have the same return time frame as in Los Angeles. It will cost the same $500 to process the paperwork. It will cost $100 for the plane ticket. I will have to spend 3 nights in Singapore at $150 a night. The total cost for this option is $1050.
Alternative Cost Duration Living Preference
1 – Las Vegas $2500 Monthly No
2 – Indonesia Tourist $1711.76 Annual Yes
3 – KITAS LA $1900 Annual Yes
4 – KITAS Singapore $1050 Annual Yes


Selection of the criterion

  1. Dominance
  2. Satisficing
  3. Disjunctive Resolution
  4. Lexicography

Analysis and comparison of the alternatives

Paired Comparison – Dominance

Alternative 1 Vs. 2 1 vs. 3 1 vs. 4 2 vs. 3 2 vs. 4 3 vs. 4
Cost 2 > 1 3 > 1 4 > 1 2 > 3 4 > 2 4 > 3
Duration 2 > 1 3 > 1 4 > 1 Same Same Same
Living Preference 2 > 1 3 > 1 4 > 1 Same Same Same
Domination Yes Yes Yes No No No


Feasible Ranges for Satisficing

Attribute Minimum Acceptable Value Maximum Acceptable Value Unacceptable Alternative
Cost 0 1500 Alternative1 eliminated by dominance. 2 and 3 are eliminated by maximum value
Duration Annual Annual No effect, but alternatives 1, 2, and 3 are already eliminated
Living Preference Indonesia Indonesia No effect, but alternatives 1, 2, and 3 are already eliminated


Selection of the preferred alternative

The preferred alternative is alternative 4 which is to get my KITAS in Singapore.

Performance monitoring and post evaluation results

Based on my results I have found that is more cost effective to stay in Indonesia. The multi attribute decision analysis eliminated all alternatives but one at satisificing eliminating the requirement of Disjunctive Resolution or Lexicography.

Posted in David King, Week #12 | 1 Comment

W.11 – David King – Prepared for Rejection, Looking for Opportunity


Problem Recognition, Definition, and Evaluation

As I have been applying for job opportunities for the last 5 months, I am finding it difficult to find a new opportunity. In the last 5 months I have applied at over 500 jobs and haven’t received one call for an interview. I was at a U.S. Government virtual career fair where over 1500 people showed up for only 9 jobs available.

There are many causes for this:

  • Not enough jobs available on the job market
  • Job market is flooded with unemployed talent
  • Too many applicants per position
  • Positions are being reserved for people known to the hiring manager, not necessarily the best talent.

I plan on addressing the root cause of positions being reserved for people know to the hiring manager.

Development of the feasible alternatives

  1. Network with the people doing the hiring to find a job paying $100,000 a year for the next 20 years accounting for 3% inflation and cost of living increases.
  2. Create your own job opportunity or company that pays $150,000 for the next 5 years accounting for 3% inflation and cost of living increases.

Selection of the criterion

  1. Future Worth
  2. Time Value

Analysis and comparison of the alternatives

Future Worth Alternative 1:

P = $100,000

i = 3%

N = 20

FW = P(F/P, 3%, 20)

FW = 100000(1.8061) = $180,610

Future Worth Alternative 2:

P = $150,000

i = 3%

N = 5

FW = P(F/P, 3%, 5)

FW = 150000(1.1593) = $173,895

Time Value Alternative 1:

I estimate my time to be worth $48.07 per hour ($100000 annual salary / (52 weeks * 40 hours per week)). I believe it takes 1 month of work or 160 work hours to account for each $10,000 you are looking for in expected salary which means it would take 10 months or 1600 hours to get the job.

1600 hours * $48.07 = $76,912.00

Time Value Alternative 2:

I estimate my time to be work $72.11 ($150000 annual salary / 52 weeks * 40 hours). I believe it takes 240 hours a month to create your own opportunity or company. I believe it takes 24 months to develop a good reputation and start to develop return on investment.

240 hours * 24 months * 72.11 = 415,353.60

Selection of the preferred alternative

Future worth is the most important attribute. Alternative 2 is the best option because it has the best future worth, but also poses the highest risk as there is no guarantee of creating the job or the company being successful where with Alternative 1 will give a blanket of security at the same rate, but it takes nearly 15 years longer to get to a comparable number.

Performance monitoring and post evaluation results

The problem with the time value alternatives is that they are costs of time and can’t be recovered directly. For example I can’t charge a company for my time lost while not having a job. The owner of the company could get compensated for the time it took to setup the business until many years later and if it is still profitable.


Posted in David King, Week #11 | 1 Comment

W.7-David King – Planning a trip with two forks in the road – Mentored by CN


Problem Recognition, Definition, and Evaluation

In the near future my sister is getting married. As a result of her getting married I was planning on spending additional time after the wedding with the family since I am rarely at home. A big part of my motivation was to spend additional time with my grandfather in my hometown. However, my grandfather has had some medical problems and won’t be attending the wedding or coming to my hometown. As staying in Las Vegas can be expensive, would be it better to go home early, go to NY to visit him and leave on the original ticket, or stay in Las Vegas the whole time?

Development of the feasible alternatives

  1. Go home early.
  2. Make an extra trip to New York to spend a week with my grandfather.
  3. Stay the entire trip in Las Vegas.

Develop Cash flows for each outcome

  1. If I was to go home early, I would shorten the trip by 1 week. I would have to pay $300 for changes to my reservation to the airline. However, I would save an additional $750 a day between hotel, rental car, and incidentals which leads to an estimated $400 in savings.
  2. To make the trip to New York, it would cost an estimated additional $1000 round trip. I wouldn’t incur any incidental fees, pay for a hotel, or need a rental car. This option would be $250 more expensive than staying in Las Vegas for the entire week.
  3. The cost of staying the entire trip in Las Vegas would equal $750 for the additional week.

Selection of the criterion

Lexicography

Attribute Rank Alternative Rank
Cost 2 Alternative 1 > Alternative 2 > Alternative 3
Time with Grandfather 1 Alternative 2 > Alternative 1 = 3
Time spent travelling 3 Alternative 1 = 3 > Alternative 2


Analysis and comparison of the alternatives

As my grandfather isn’t feeling well it is important to me that I see him and spend time with him. Cost ranks high for me as I have practically no cash coming in and the trip is costly. Time spent travelling to me is irrelevant, but I know my wife can’t handle the flying as I can. However I know she ranks cost and time with my grandfather over the time spent travelling.


Selection of the preferred alternative

If I assigned points based on the outcome for each attribute with 3 points for winning the rank, 2 for second place, and 1 for last place this is how the score would come out.

Alternative 1: 7 points

Alternative 2: 6 points

Alternative 3: 5 points

Based on this method alternative 1, returning from the trip early is the preferred alternative.

Performance monitoring and post evaluation results

Based on the fact that lexicography was used to determine the winning alternative which gave higher preference to the higher scoring of the lower ranked attributes. If any other method of multi-attribute decision making was used, it is very likely that the alternative 2 would have been the preferred alternative.

Posted in David King, Week #7 | 2 Comments

W.6_David King_Instant Income Dillemma – Mentored by CN


Problem Recognition, Definition, and Evaluation

As I have been unemployed for several weeks now, I need to find a new source of income to provide for my family.

Development of the feasible alternatives

  1. Find a new job with a large company in Indonesia.
  2. Find a new job with a small company in Indonesia.
  3. Find a new job outside Indonesia.
  4. Get accepted for a graduate program and take out a student loan.

Develop Cash flows for each outcome

  1. Finding a new job in Indonesia is a challenge as an expatriate. I meet all the minimum requirements to work in Indonesia, but to find a company willing to give me an expatriate package is a different story. Since I am already here I would take a local package. To find work with a large company in Indonesia, it would take building a network with large Indonesian firms. I can do this several times a month, but it would cost about $300 months to attend all the events and will take several months to possibly get something out of it.
  2. I can look for a small company to hire me in Indonesia, but I would have to sacrifice pay and have a lot of trust in this company and the people that run the company. There are many risks involved with being hired by a local company, but I would also get greater freedom, trust, and responsibility. To find a job like this would require a different type of networking combined with the networking from alternative 1 and would probably cost me an additional $100 a month from alternative 1 and will take several months as well.
  3. I am open to working anywhere that won’t get me killed. The problem is to get a job is a job which requires a lot of phones calls, networking, and using people who I previously worked with for future opportunities. I estimate that I would run up a $50 phone bill a month on international calls combined with 6-8 hours a day at 7 days a week for several months.
  4. I am open to expanding my knowledge and the opportunities available with a graduate degree. As well I can get an additional loan to cover my current expenses while waiting for additional work which will eventually pay off the loan. It will cost about $200 between all fees involved with setting it up; however, it will take several weeks to get setup.

Selection of the criterion

Lexicography

Attribute Rank Alternative Rank
Cost 3 Alternative 4 > Alternative 3 > Alternative 1 > Alternative 2
Cash Flow 1 Alternative 4 > Alternative 3 = Alternative 1 > Alternative 2
Time/Speed 2 Alternative 4 > Alternative 3 > Alternative 2 = Alternative 1


Analysis and comparison of the alternatives

Due to my current financial situation of having no cash coming in, positive cash flow is important even if I have to pay it back later. The other alternatives all take cash with no guarantee of how much or when cash will be coming in.

Selection of the preferred alternative

Alternative 4 wins by dominance of all other alternatives. It has the lowest cost and is the soonest to bring in positive cash flow.

Performance monitoring and post evaluation results

The other alternatives would have posed more of a probability of effecting the outcome to a different alternative if the time it takes to get a job wasn’t so long or difficult. If any of the job opportunities were able to deliver in a more timely fashion then it would have been in my best interests to seek income from a job. However, there is no reason why I can’t have a job, and continue my education.

Posted in David King, Week #6 | 1 Comment