Kubernetes: Limits and Requests

Recently at work, one of our workloads on kubernetes was erroring out a lot and grafana showed that the pods were being CPU-throttled 50-60% of the time.

That was weird, because the pods were nowhere close to hitting their limits. I decided to dig and I ended up in a rabbit hole quite deep. Here’s what I found.

NOTE: The text below is a mix of copy-pasting from a few websites, some paraphrasing, and custom text. A lot of this information here is not originally mine. I present it here for (hopefully) better understanding.

Cpu requests and cpu limits (in K8S and Linux) are implemented using two separate control systems.

In K8S land, cpu requests serve two purposes. One, it lets kubelet decide which node is suitable for a pending pod. Two, once the pod is scheduled, the requests are translated into docker-level flags known as CPU shares. This is the CPU shares system.

https://docs.docker.com/engine/reference/run/#cpu-share-constraint

By default, when no requests are set, all containers get the same proportion of CPU cycles. When you set a “Request” however, this number is translated into a proportion. This proportion is applied as a CPU share ‘weight’ to the container, which is relative to the weighting of all other running containers.

Let me explain. In Linux, CPU shares work by dividing each CPU-core into 1024 slices and guarantee that each process will receive its proportional share of those slices. With 1024 slices, if each of two containers sets cpu.shares to 512, then they will each get about half of the available CPU time.

However, the proportion is enforced only when CPU-intensive processes are running. When tasks in one container are idle, other containers can use the left-over CPU time. Therefore, the actual amount of CPU time of a container will vary depending on the number of containers running on the system.

For example, consider three containers, container1 requesting 256 shares, and the other two 512 each, and the system of 1024 cpu shares is busy, i.e when processes in all three containers attempt to use 100% of CPU. The proportion for container1 is 1024/5 = 204.8 and 409.6 for each of container2 and 3. Where did the number ‘5’ come from? This works on least-common-denominator principle. Here, 256 is the LCD. Let’s call it ‘X’. 512 is 2X. We have a total of 1X + 2X + 2X weights = 5X competing for 1024 shares = 1024/5.

On a multicore CPU, the shares of CPU time are distributed over all CPU cores. On a 2-core system that is busy, a container requesting for 256 shares, is allowed to use all the cores of the CPU for its allowed proportion of CPU-time. So it can either use 256 shares on one core or 128 each on both cores.

So far so good. However, the cpu shares system cannot enforce upper bounds. This is because the (CFS) Scheduler releases the unused CPU to the global pool so that it can allocate it to the cgroups that are demanding for more CPU power. If one process doesn’t use its share, the other is free to. And, this is where limits come into picture.

K8S uses Linux’s CFS (Completely Fair Scheduler – Linux’s default cpu scheduler) quota mechanism to implement limits. This is done using a system called “cpu bandwidth control”. https://www.kernel.org/doc/Documentation/scheduler/sched-bwc.txt.

The bandwidth control system defines a time period ‘cfs_period_us‘ (“us” == microseconds), which is usually set to 1/10 of a second, or 100,000 microseconds, and a quota ‘cfs_quota_us‘ which represents the maximum number of slices in that period that a process is allowed to run on the cpu. Quota is reset after the expiry of ‘cfs_period_us’ period.

Kubernetes divides cpu cores into 1000 shares (unlike 1024 at the Linux cpu control group and docker level). In K8S, we usually define our requests/limits with the ‘m’ notation, where the unit suffix ‘m’ stands for “thousandth of a core”.

Assuming you’ve configured a pod’s limit to 200m, that is 200/1000th of a core. With cpu.cfs_period_us set to 100000, for every 100,000 microseconds of CPU time, your pod can get 200/1000 * 100,000 microseconds = 20,000 microseconds of unthrottled CPU time. So your limit translates to setting cpu.cfs_quota_us=20000 on the process’s cpu.

To re-iterate, this is 20ms of CPU time slice available to the process out of each 100ms time period, during which the process gets unfettered access to all the CPU cores on the system.

Additionally, when you specify CPU limits on a container, you’re actually limiting its CPU time across all of the node’s CPUs, not restricting the container to a specific CPU or set of CPUs. This means that your container will sees (and can use) all of the node’s CPUs — it’s just the time that’s limited. For example, specifying a CPU limits of 4 on a node with 8 CPUs means the container will use the equivalent of 4 CPUs, but spread across all CPUs. In the above example with 20ms quota, on a two core system, the process can use 10ms each on both cores or 20ms on one core.

In the case of our problematic pod, the pods requests/limits were set to:

  resources:
    requests:
      cpu: 50m
      memory: 256Mi
    limits:
      cpu: 400m
      memory: 1Gi

This means that the pod is requesting for a node with atleast 50m minimum CPU shares available. If there was no limit, the pod is free to consume as much CPU as is available when required. On a busy system, the pod gets atleast its 50m weighted share of the CPU cores.

Coming to the limits, the pods get 40ms of unthrottled CPU in a 100ms period. If the pod’s process(es) need more CPU time than that provided by the 50m CPU request/share, they can do so within the 40ms of allotted CPU time. However, if the pod needs more CPU time, it has no option but to wait for 60ms so that the 100ms cfs_period_us time period expires/resets, and it can get a fresh quota for another 40ms.

Looking at the metrics, our pods were not actually exceeding or even coming close to the 400m limit if you look at it from a purely CPU shares perspective. The CPU usage of the pods was hovering around 200 – 300m. However, the pods needed more CPU time than its 50m weight guaranteed, or the 40ms bursts allowed. So they were being throttled for the rest of the 60ms.

Plus, all the throttling was flip-flopping the health of the pod, which also seemed to increase the CPU load/requirement of the pods. Once the limit was raised to 1000m, which is 100ms of 100ms and equal to one CPU core , the pod’s throttling stopped, and the CPU usage also dropped comparitively. The request was also bumped to 250m to allow for a higher baseline CPU weighted share for the pod. The pod can use the 100ms cpu_quota to use one-CPU core worth CPU-time on the system. It can take 100% of a CPU core, or 25% of all CPU cores on a 4-core system, however it sees fit.

If you want a (poor) analogy, let’s talk about cars on a highway. CPU ‘m’ notation is ‘kph’, ‘cfs_quota_us’ is set to 100seconds, each container is a car, and the system is our highway.

– In a system without requests/limits on containers, cars are free to travel at whatever speed they want to as long as there’s no traffic and within the limits of the highway design (system capacity). If there’s traffic, things get messy because every car tries its best to use up the highway capacity for its own.

– In a system with requests on containers, cars are guaranteed to travel at a speed they initially choose. Let’s assume that is 50kph (or 50m in K8S). They are allowed to burst to whatever speed they require as long as there’s no traffic and within the limits of the highway design (system capacity). Even in the heaviest of traffic, this car will still be allowed to travel at 50kph, guaranteed.

– In a system with requests and limits on containers, assuming 50m req and and 400m limits from above. The limit translates to 400/1000*100seconds = 40seconds. This car is guaranteed to travel at a minimum of 50kph or can travel at whatever speed it requires as long as there’s no traffic and within the limits of the highway design (system capacity). BUT, the limits restrict the car to running for only 40 seconds of a 100 second time period. So the car can do 800kph (if there’s capacity) but has to abruptly stop after it’s exhausted 40s of allotted time. Then restart after the end of the 100s time period, then stop again in 40s.

Then, let’s say this particular car model also needs to travel at a baseline 120kph to be able to perform optimally, and we only guarantee 50kph, then it’s performance is going to suffer as well.

I told you it wasn’t a great analogy.

Other interesting bits:

Things get a little more complex if you think about a multi-threaded process. In K8S land, each thread can unfortunately also be counted against the CPU quota as well (https://github.com/kubernetes/kubernetes/issues/67577#issuecomment-417321541), so if our pod’s process has two threads, the combined two-thread process would only sustain 40ms/2 = 20ms of unthrottled CPU, and face 80ms of throttling.

Finally, Guaranteed pods in K8S are pods where the limits == requests in the pod spec. However, contrary to what the term implies, gauranteed pods are also throttled based on the limits. For example, a pod with CPU request and limits set to 700m, the pod is requesting for a node with 700m free CPU shares. That is a guarantee of 700m weight (not CPU) on the total of all CPU cores on the node. K8S doesn’t oversubscribe nodes, but if there are pods without requests, or pods that are keeping the system busy, then the 700m could translate to less than ideal CPU time. However, without limits, if the pod needs more CPU, and the system’s idle, it’ll get more CPU.

Now, coming to the limits, 700m translates to 70ms (700/1000 * 100,000). Thus, the pod is allowed unfettered CPU access for 70ms of a 100ms period. That’s only 70% of a CPU core for the pod. Can you see how that can be a problem? The pod’s request allows it 700m weight share cpu on the system, and full freedom to burst away to glory, but is limited to only 70ms runtime which equates to just 70% of one CPU core. See “multi-CPU” example: https://www.kernel.org/doc/Documentation/scheduler/sched-bwc.txt. It’s a better idea to either get rid of the limit or set a limit according to the usage of the pod.

(Also read: https://medium.com/expedia-group-tech/kubernetes-container-resource-requirements-part-2-cpu-83ca227a18b1)

Posted in Tech. | Leave a comment

Jenkins agents on AWS EKS

The steps outlined here should help you setup Jenkins agents on AWS EKS clusters. The agents are one-time only. In other words, every build gets a fresh agent and then it is thrown away.

The big advantage with Kubernetes is the concept of the pod, which supports multiple containers as a unit, and we make use of that here by bundling a Docker-in-docker container along with the main JNLP container.

PreReq
– The VPC in which Jenkins Master is placed should have network connectivity via either being placed in the same VPC / VPC-peering / Transit-gateway connection.

Jenkins Master
– Plugin kubernetes-plugin https://github.com/jenkinsci/kubernetes-plugin  must be  installed. The minimum required version of this plugin is 1.23.2, which can only be installed on Jenkins version 2.190.1 and up.

– awscli version requirement minimum 1.16.300 and up. Previous versions do not support the command $ aws eks get-token which is a requirement for the plugin functionality.

– (This is no longer required for Kubernetes plugin versions 1.24.1 and up)
Java option “-Dorg.csanchez.jenkins.plugins.kubernetes.clients.cacheExpiration=60”
must be set in /etc/sysconfig/jenkins. This is to force the plugin to refresh the EKS token every 1 minute. The default cacheExpiration value is 24 hours which is much higher than the validity of EKS tokens (15min). Link: https://github.com/jenkinsci/kubernetes-plugin#running-with-a-remote-kubernetes-cloud-in-aws-eks

Jenkins ELB
– The security group for Jenkins ELB needs to allow TCP:$JNLP_PORT and TCP:443 from the EKS worker-node security group. This allows the launched pod to communicate back to Jenkins as “Ready”, among other communication. The JNLP port for Jenkins is defined when you setup Jenkins and is found in Manage Jenkins.

EKS
– The EKS cluster security group needs to allow TCP:443 from Jenkins Master security group. This allows Jenkins Master to communicate with EKS to launch pods.

– Modify the aws-auth ConfigMap for the EKS cluster to allow the Jenkins Masterʼs IAM role access to the EKS cluster to start/stop pods. The IAM role of the Jenkins-Master should show up this way:

apiVersion: v1
kind: ConfigMap
metadata:
name: aws-auth
namespace: kube-system
data:
mapRoles: |
<-snip->
- rolearn: arn:aws:iam::<snip-acc-num>:role/rol-ops-tool-jenkins-master
username: jenkins
groups:
- fake-group-because-module-wants-it
mapUsers: |
mapAccounts: |

– Add a Role and a RoleBinding to the EKS cluster with policies that grant Jenkins permissions to spin up/down pods in the ‘operations’ namespace, among a few other actions. If you use helm, this is how you could do it:

---
{{- if .Values.jenkins_agent.enabled -}}
apiVersion: rbac.authorization.k8s.io/v1
kind: RoleBinding
metadata:
name: jenkins-agent-role-binding
namespace: operations
roleRef:
apiGroup: rbac.authorization.k8s.io
kind: Role
name: jenkins-agent-access
subjects:
- kind: User
name: jenkins
apiGroup: rbac.authorization.k8s.io
{{- end }}

---
{{- if .Values.jenkins_agent.enabled -}}
kind: Role
apiVersion: rbac.authorization.k8s.io/v1
metadata:
namespace: operations
name: jenkins-agent-access
rules:
- apiGroups: [""]
resources: ["pods"]
verbs: ["create","delete","get","list","patch","update","watch"]
- apiGroups: [""]
resources: ["pods/exec"]
verbs: ["create","delete","get","list","patch","update","watch"]
- apiGroups: [""]
resources: ["pods/log"]
verbs: ["get","list","watch"]
- apiGroups: [""]
resources: ["secrets"]
verbs: ["get"]
{{- end }}

KubeConfig
– Generate a kubeconfig file for the cluster of your choice. Run this on your computer after logging into the account holding the EKS cluster:

$ aws eks list-clusters --region us-east-1 --output text
CLUSTERS my-awesome-cluster-7MWC

– Then fetch the kubeconfig for this cluster:

$ aws eks update-kubeconfig --name my-awesome-cluster-7MWC --kubeconfig config_file
Added new context arn:aws:eks:us-east-1:<snip-acc-num>:cluster/my-awesome-cluster-7MWC to <snip>

Remember the location of this file on your machine.

Jenkins UI
These changes must be made manually from the UI. Our Jenkins is built on EFS so our master remains stateless and stores everything on the EFS volume. This EFS volume is backed-up regularly, plus we installed the Jenkins Config-History plugin that ensures that we’re never far away from the correct config.

Credentials

Create a credential in Jenkins of Global scope and kind ‘Secret file’. Upload the kubeconfig from the previous step.

Configuration

Browse to Jenkins > Manage Jenkins > Configure System

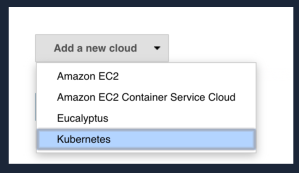
Scroll to the bottom and setup a new Cloud of type Kubernetes.

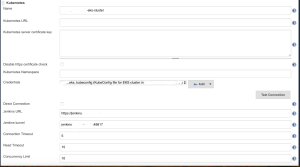
Setup the EKS cluster, choosing the kubeconfig credential created in the previous step. The Kube URL and certificate are automatically fetched from the kubeconfig credential, and are not required to be set here.

Click “Test Connection” button and ensure you see a message Connection test successful before proceeding.

Enter the URL for your Jenkins website for “Jenkins URL”, such as “https://jenkins.example.com&#8221;

Jenkins tunnel: is your Jenkins domain followed by the Jenkins JNLP port, such as “jenkins.example.com:49817”. This port is defined in Jenkins > Manage Jenkins > Configure Security.

Next, click “Pod Templates..“ and click “Add Pod Template”. The label defined in the “Labels” text-box is how you’d use this agent from within your builds/pipelines. Labels are separated by a space.

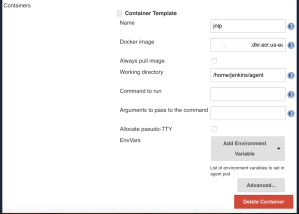
In the Container section, add a container that contains the jnlp-slave agent. This is the container that runs the JNLP jar and connects the slave to the master. Our image is hosted on ECR and is based off of this Dockerfile: https://github.com/jenkinsci/docker-agent/blob/master/8/alpine/Dockerfile

You can add environment variables for this container. In our case, we set one for defining the AWS region.

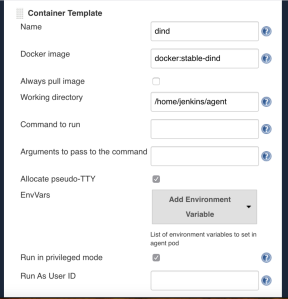
Optionally, add a second container. In our case, we add a “Docker-in-Docker” image so we may build docker images in our pipeline. Note, docker-in-docker requires that the container be run in the “Privileged” mode. This checkbox is accessible by clicking on the “Advanced” button for the container section.

(Optional) In the “Advanced” section for both the containers, add CPU and Memory limits to prevent the pod from consuming too much of available node resources. Example: 

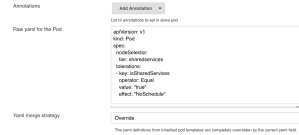
(Optional) Add raw-YAML for the pod to define additional Pod-spec. In our case, we define a nodeSelector to select a set of nodes:

Next, scroll down and modify the “Workspace Volume” option to “Empty Dir Workspace Volume”. The default option creates an EBS volume in the background which is not only unnecessary, but also slows down pod-launch times. An empty-dir volume https://kubernetes.io/docs/concepts/storage/volumes/#emptydir  provides a scratch space for the build, and uses the underlying EKS worker-node’s disk.

Click “Save” at the bottom of the page. You’re done!

Using the Jenkins pod – the jnlp and dind containers

Pipeline Groovy

In this example, the ‘infra-pod’ agent is called at the pipeline level. The first stage uses the jnlp container (which, in our case, points to the infra-node image). The second stage specifically calls for the ‘dind’ container within the ‘infra-pod’ and builds a docker container within it.

pipeline {
    agent { label 'infra-pod' }
    //Pipeline options
    options {
        ansiColor('xterm')
    }

    stages {
        stage('This stage uses the jnlp container') {
            steps {
                echo "Test"
                    withCredentials([[$class: 'AmazonWebServicesCredentialsBinding', credentialsId: "aws-nonprod"]]) {
                    sh '''
                        aws sts get-caller-identity
                        '''
                    }
            }
        }
        stage('This stage uses the dind container'){
            steps {
            container('dind') {    
                    dir("containers") {
                        checkout scm: [$class: 'GitSCM', userRemoteConfigs: [[url: "git@github.com:Example/containers", credentialsId: 'github-jenkins-ssh-key']], branches: [[name: 'master']]]
                        sh '''
                            docker build example-container -t .
                        '''
                    }
                }
            }
        }        
    }
}

Sharing files between stages

The $WORKSPACE is a variable available in your builds. This variable points to the workspace directory for the current build, and it is shared across stages. This is the mount that we configured when we setup the pod in previous steps.

This shared mount allows another subsequent stage to access files, artifacts, and directories created in a previous stage.

For example, you could create a Dockerfile in one stage and build a docker image in a subsequent stage using the ‘dind’ container.

Posted in Tech. | Tagged , , , , , , , | Leave a comment

Jenkins Declarative Pipeline: Run a stage without holding up an agent

If you have a Jenkins declarative pipeline , you’re generally bound to have more than one stage with steps within each of them. The usual way of declaring a node/agent/slave is by declaring an agent directive encompassing the stages{} directive, like so:

pipeline {
    agent { label 'mynode' }
    stages { 
        stage('Example') {
            steps {
                echo 'Hello World'
            }
        }
    }
}

However, occasionally you may wish to run a stage or two that doesn’t require an agent. A simple example would be a timeout or a sleep stage that is waiting for a previous stage to finish. If your timeout lasts more than a few minutes, you’d want to release the agent so another build may use it. Holding up an agent is a crime in Jenkins world.

(Although this is shown in the document link I shared above, it isn’t tagged for this usecase as such.)

Here’s a simple way to go about doing that:

pipeline {
    agent none

    stages {

        stage('Stage Do Something') {
            agent { label 'mynode' }
            steps {
                    echo "Something"
            }
        }

        stage('Stage Sleep') {
            agent none
            steps {
                sleep time: 3, unit: 'HOURS'
            }
        }


        stage('Stage Do More Of Something') {
            agent { label 'mynode' }
            steps {
                    echo "More Of Something"
                }
            }
    }
}

‘Stage Sleep’ here is declared with agent none which simply retires the agent until it is called again in the next stage.

Hope that helps someone looking for a quick answer.

Posted in DevOps | Tagged , , , , , , , , | Leave a comment

AWS: Prevent VPC Modifications

If you have a busy AWS environment accessed by multiple developers, you will have someone modify your some aspect of your core infrastructure inadvertently.

In our case, we have our VPC-related infrastructure deployed using Cloudformation and maintained via CF stack updates. When devs modified VPC-related resources by circumventing CF stack updates, they rendered our infrastructure out-of-date and un-update-able by CF. Tracking these changes via CloudTrail and rolling them back manually was starting to cost us time and frustration.

Note: Our devs use SSO to login to AWS. Upon login, they assume cross-account roles attached with policies that determine what they can or cannot access.

Assuming that you have your developers sign-in in a similar fashion, below is a policy you can attach to that role to prevent them from modifying VPC-related resources.

Notice how, at the end of this policy, is a section that denies the deletion of this policy from the role? That is key to prevent devs from simply removing this policy from the role.

{
    "Version": "2012-10-17",
    "Statement": [
        {
            "Effect": "Deny",
            "Action": [
                "ec2:CreateDhcpOptions",
                "ec2:DeleteFlowLogs",
                "ec2:DeleteSubnet",
                "ec2:ReplaceRouteTableAssociation",
                "ec2:DeleteVpcPeeringConnection",
                "ec2:DeleteVpcEndpoints",
                "ec2:AcceptVpcPeeringConnection",
                "ec2:AttachInternetGateway",
                "ec2:DisableVgwRoutePropagation",
                "ec2:AssociateVpcCidrBlock",
                "ec2:ReplaceRoute",
                "ec2:AssociateRouteTable",
                "ec2:DeleteRouteTable",
                "ec2:DisassociateVpcCidrBlock",
                "ec2:DeleteVpnGateway",
                "ec2:ReplaceNetworkAclEntry",
                "ec2:CreateRoute",
                "ec2:CreateInternetGateway",
                "ec2:ModifyVpcPeeringConnectionOptions",
                "ec2:CreateVpnGateway",
                "ec2:DeleteInternetGateway",
                "ec2:DeleteVpnConnection",
                "ec2:CreateVpcPeeringConnection",
                "ec2:EnableVpcClassicLink",
                "ec2:CreateRouteTable",
                "ec2:DetachInternetGateway",
                "ec2:CreateCustomerGateway",
                "ec2:DisassociateRouteTable",
                "ec2:ReplaceNetworkAclAssociation",
                "ec2:DetachVpnGateway",
                "ec2:CreateDefaultVpc",
                "ec2:DeleteDhcpOptions",
                "ec2:AssociateSubnetCidrBlock",
                "ec2:DeleteNatGateway",
                "ec2:DeleteVpc",
                "ec2:CreateSubnet",
                "ec2:DeleteNetworkAclEntry",
                "ec2:ModifyVpcEndpoint",
                "ec2:CreateVpnConnection",
                "ec2:CreateNatGateway",
                "ec2:CreateVpc",
                "ec2:ModifySubnetAttribute",
                "ec2:CreateDefaultSubnet",
                "ec2:CreateNetworkAcl",
                "ec2:ModifyVpcAttribute",
                "ec2:DeleteNetworkAcl",
                "ec2:AttachClassicLinkVpc",
                "ec2:AssociateDhcpOptions",
                "ec2:AttachVpnGateway",
                "ec2:DeleteRoute",
                "ec2:CreateVpnConnectionRoute",
                "ec2:DisassociateSubnetCidrBlock",
                "ec2:DeleteVpnConnectionRoute",
                "ec2:DeleteCustomerGateway",
                "ec2:CreateVpcEndpoint",
                "ec2:EnableVgwRoutePropagation",
                "ec2:DisableVpcClassicLinkDnsSupport",
                "ec2:DisableVpcClassicLink",
                "ec2:ModifyVpcTenancy",
                "ec2:EnableVpcClassicLinkDnsSupport",
                "ec2:CreateNetworkAclEntry"
            ],
            "Resource": "*"
        },
        {
            "Effect": "Deny",
            "Action": "iam:DeleteRolePolicy",
            "Resource": "arn:aws:iam::999999999999:role/Dev-Role-MBHPPM0DPW90"
        }
    ]
}
Posted in Amazon Web Services, DevOps | Tagged , , , , , , , , , | Leave a comment

Cloudformation: Optional Resource Parameters

When creating Cloudformation templates, occasionally, you come across situations where you only want to remove parameters from a Resource when on certain conditions. As an example, for an ECS Service resource, the parameters ‘LoadBalancers’ and ‘Role’ are both required only if you want your service to be serviced by a loadbalancer. However, you may not want to create two templates to serve these two use cases: 1. Service with LB registration, and 2. Service without LB registration.

In such cases, you can make use of Cloudformation’s conditions, conditionals, and pseudo parameters. This use-case is defined in AWS documentation, but it can be hard to end up on that page via a Google search for terms such as ‘Cloudformation optional parameter turn off’

Here’s a quick example to achieve this in Yaml:

  Service:
    Type: 'AWS::ECS::Service'
    DependsOn:
      - LogGroup
    Properties:
      Role:
        !If
          - CreateTargetGroup
          -
            !ImportValue
            'Fn::Sub': '${ClusterStackName}-EcsServiceRole'
          - !Ref "AWS::NoValue"
      TaskDefinition: !Ref TaskDefinition
      DesiredCount: !Ref AppDesiredCount
      LoadBalancers:
        !If
          - CreateTargetGroup
          -
            - TargetGroupArn: !Ref TargetGroup
              ContainerPort: !Ref AppContainerPort
              ContainerName: !Ref AppName
          - !Ref "AWS::NoValue"
      Cluster: !ImportValue
        'Fn::Sub': '${ClusterStackName}-ClusterName'
      PlacementStrategies:
        - Field: 'attribute:ecs.availability-zone'
          Type: spread
        - Field: instanceId
          Type: spread
Posted in Amazon Web Services, DevOps | Tagged , , , , , , | Leave a comment

AWS: Deleting Old Access-Key/Secret-Key Pairs

If you have a busy AWS environment with access to multiple developers , it can be useful to automatically clean up IAM user Access Keys every so often for security.

Here’s a simple Python script that can be plugged into an AWS Lambda function to cleanup Access-Key/Secret-Key Pairs older than 90 days.

The script has a whitelist capability if you want to avoid cleaning up IAM users from a certain IAM group.

The script also removes password profiles from IAM users in case your company policy is to use SSO and prevent users from creating their own AWS Console logins.

import boto3, sys, datetime, time

def cleanup(user,iam_client):
    response = iam_client.list_access_keys(UserName=user)
    for key in response['AccessKeyMetadata']:
        create_date = time.mktime(key['CreateDate'].timetuple())
        now = time.time()
        age = (now - create_date) // 86400
        if age > 90:
            print "AK [",key['AccessKeyId'],"] for user [", user, "] is older than 90 days. Deleting..."
            response = iam_client.delete_access_key(
                UserName=user,
                AccessKeyId=key['AccessKeyId']
            )

    # Check if user has password profile
    try:
        response = iam_client.get_login_profile(UserName=user)
    except Exception as e:
        if 'NoSuchEntity' not in str(e):
            raise
    else:
        print "User [",user,"] has password profile. Deleting.."
        response = iam_client.delete_login_profile(UserName=user)


def handler(event, context):
    iam_client = boto3.client('iam')
    user_list=[]
    group_list=[]
    whitelist_group_name="automation-users"

    response = iam_client.list_groups()
    for item in response['Groups']:
        group_list.append(item['GroupName'])

    if whitelist_group_name not in group_list:
        print "Automation Users Group Doesn't Exist! Script Exiting."
        sys.exit(1)

    response = iam_client.list_users()
    print "----------------------------------------------"
    for item in response['Users']:
        user = item['UserName']
        is_automation_user=False
        user_list.append(user)
        response = iam_client.list_groups_for_user(UserName=user)
        if response['Groups']:
            for group in response['Groups']:
                if group['GroupName'] == whitelist_group_name:
                    print "User [",user,"] is an automation-user. Won't be touched."
                    is_automation_user=True
        if is_automation_user==True:
            print "----------------------------------------------"
            continue                    
        else:
            print "User [",user,"] is a regular user. Checking credentials.."
            cleanup(user,iam_client)
            print "Cleanup on user [",user,"] is now complete."
        print "----------------------------------------------"
Posted in Amazon Web Services, DevOps | Leave a comment

Real Backups On The Cheap

So you have your data on the “cloud” – on Dropbox or GDrive folders – and you believe you’ve done a decent job of safe-guarding your precious files, while really you’ve only saved your files against total computer or hard-drive loss. I used to be this guy until one day when I discovered a few of my precious files went missing from Dropbox. I searched and searched everywhere to discover I’d truly lost them. Was it an accidental delete, or was it a bad program that deleted it? I’ll never know.

While free-Dropbox comes with free 30days restore, it did not have my precious files, and that made me realize that we all have way too much stored in our cloud-folders and there is absolutely no way one can keep a handle on what was deleted/added/modified and when.

Although this incident taught me a lesson and made me store offline-copies of my data on another hard-drive, I really had to go through another painful loss before I seriously started looking for an alternative. Several albums belonging to my really precious music collection (synced across my computers using Resilio, Play Music, and duct-tape) got corrupt and/or missing at some point and were nicely synced across all devices. Again, the sheer volume of data (10,000 music files) ensured I’d find out much much later after too much damage had been done.

So now, I seriously started looking for a solution that would endure the tests of time, stupidity, bad software, and a drunk-me. A solution that would ensure extreme durability while still maintaining relatively quick access when needed.

Enter: AWS S3

Now, I’m sure you know everything about S3 and how inexpensive it can be (0.023 per GB/month for standard-class) to store multiple GBs or TBs of data. But if you’re not an enterprise user, and you’re like me who likes simple and cheap, you’re probably considering S3’s infrequent-storage class at 0.0125 per GB/month. At around 60GB of potential data to store on the cloud, that is just 9$ USD per year vs S3’s standard-class ~17$. But, wait, there’s something even cheaper.

Enter Glacier – the cloud-tape solution from Amazon. Glacier is cheap, as durable as S3 standard-class (99.999999999% durability) and comes at a dirt cheap 0.004$ per GB/month cost. That really is 0.4cents. For 60GB, my cost for the entire year is 2.88$. I remember paying 100$ for a 4.75GB HDD way back. Today, I pay 4.8$ for 100GB of ultra-durable and multi-AZ-replicated storage on Glacier. Times have changed, indeed!

However, before you close this tab and proceed to backup your files into Glacier using a glacier tool (such as, Freeze or FastGlacier), I’d like to let you know that once you upload to a Glacier vault, you will need to request AWS to have access to your data. This includes listing of the contents, so uploading to raw Glacier is not recommended for this use-case.

Instead, I recommend uploading your data into an S3 bucket with a lifecycle management policy set to move data into Glacier 0-days (zero-days) after upload. This ensures that your objects in S3 are moved to Glacier end-of-zeroth-day so you’re not billed for even a single day of S3 storage. AWS moves your data into what it calls the Glacier-class of S3 storage.

This approach ensures that you always have the ability to list your glacier contents using S3 APIs/AWS console. This also lets you use cheap or free S3 tools (such as CyberDuck or S3browser) to upload your data into Glacier vs. having to spend $30+ on Glacier-specific tools such as Freeze.

I hope this was helpful. So far, I’ve managed to upload 20 of 60GB of my data and have been pleasantly surprised by how easy it has been and how much stress it takes off your mind regarding your backups.

A future blog post will detail out the steps required to download your S3-Glacier backups to your computer in an emergency.

Posted in Amazon Web Services, DevOps | Tagged , , , , , , , , , , | Leave a comment

AWS S3 Bucket Policy to Only Allow Encrypted Object Uploads

Amazon S3 supports two types of encryption (server-side-encryption or SSE) for security of data at rest — AES256, and AWS/KMS. AES256 is termed as S3-managed encryption keys [SSE-S3], whereas, KMS is termed, well, SSE-KMS where in the customer manages their encryption keys. A default KMS key is created for you the first time you use a service, such as say, S3.

For more information on SSE-S3, check out this link.
For more information on SSE-KMS, check out this link.

There is growing support among tools (such as Logstash) for AES256-based SSE, so it may make sense to choose this encryption algorithm for your data.

If you want your users (whether IAM users, IAM roles, or regular console users) to never upload un-encrypted data (for, well, security reasons), then it makes sense to have a bucket policy to explicitly deny uploads of un-encrypted objtects.

This example bucket policy was derived using this page . This policy allows for both SSE-S3 and SSE-KMS based encrypted objects while denying everything else.

{
    "Version": "2012-10-17",
    "Id": "PutObjPolicy",
    "Statement": [
        {
            "Sid": "DenyUnEncryptedObjectUploads",
            "Effect": "Deny",
            "Principal": {
                "AWS": "*"
            },
            "Action": "s3:PutObject",
            "Resource": "arn:aws:s3:::your-test-storage-bucket/*",
            "Condition": {
                "StringNotEquals": {
                    "s3:x-amz-server-side-encryption": [
                        "AES256",
                        "aws:kms"
                    ]
                }
            }
        },
        {
            "Sid": "DenyUnEncryptedObjectUploads",
            "Effect": "Deny",
            "Principal": "*",
            "Action": "s3:PutObject",
            "Resource": "arn:aws:s3:::your-test-storage-bucket/*",
            "Condition": {
                "Null": {
                    "s3:x-amz-server-side-encryption": "true"
                }
            }
        }
    ]
}

And, that is it. As simple as that!

If you’re using the AWS CLI to upload objects, here’s how to use various forms of encryption (or not):

AES256

#aws s3 cp --sse AES256  file.txt s3://test-dh01-storage/file.txt

AWS/KMS using the default aws/s3 KMS encryption key

#aws s3 cp --sse aws:kms file.txt s3://test-dh01-storage/file.txt

Unencrypted

#aws s3 cp file.txt s3://test-dh01-storage/file.txt


Posted in Amazon Web Services, Tech. | Tagged , , , , , , , , , , , | Leave a comment

DC/OS Exhibitor on S3 – Issues & Workarounds

If you want basic resiliency around your DC/OS master nodes when hosting them on AWS, you’ll want to have Exhibitor store its data in AWS S3. In order to do so, you’ll want to grant S3 IAM roles to your master nodes so they may talk to a specific S3 bucket. Then, you use this genconf/config.yaml config to install (or re-install) your DC/OS cluster:

exhibitor_storage_backend: aws_s3
aws_region: us-east-1
exhibitor_explicit_keys: false
s3_bucket: <bucket-name>
s3_prefix: my-dcos-exhibitor-file

Note: You do NOT need to have your master nodes use a load balancer (master_discovery: master_http_loadbalancer ) for discovery even if you decide to use S3 for exhibitor backend. Yes, they’re often used together, but it’s not mandatory to use them together.

Back to your installation, assuming you follow instructions here to continue the installation. Once everything is deployed, head to your S3 bucket, search for and open up the my-dcos-exhibitor-file. Here, two things can happen:

  1. You find the file doesn’t exist. In this case, take a look at your genconf/config.yaml file and count the number of master nodes that you listed in there. Here’s my list of masters:
    master_list:
    
    - 10.0.2.34
    - 10.0.0.147
    - 10.0.4.247

    If you have less than 3 master nodes in your list, then Exhibitor defaults to using a “static” exhibitor backend, and won’t use S3 to store its config. So, use 3 or more nodes and reinstall.

  2. The second issue that can happen is that only one of the master nodes succeeds to write to S3 into the my-dcos-exhibitor-file and you’re left with a broken cluster. Your services ( #systemctl | grep dcos ) will all fail and your postflight will timeout and fail( #sudo bash dcos_generate_config.sh --postflight ). You may also see tons of “null-lock-*” files hanging out in your S3 bucket:screenshot-at-2016-12-14-154748

    If this is your case, go checkout the my-dcos-exhibitor-file from S3. If you see something like this, there may be something I can do to help:

    #Auto-generated by Exhibitor 10.0.0.163
    #Wed Dec 14 19:49:59 UTC 2016
    com.netflix.exhibitor-rolling-hostnames=
    com.netflix.exhibitor-rolling.zookeeper-data-directory=/var/lib/dcos/exhibitor/zookeeper/snapshot
    com.netflix.exhibitor-rolling.servers-spec=2\:10.0.0.163
    com.netflix.exhibitor.zookeeper-pid-path=/var/lib/dcos/exhibitor/zk.pid
    com.netflix.exhibitor.java-environment=
    com.netflix.exhibitor.zookeeper-data-directory=/var/lib/dcos/exhibitor/zookeeper/snapshot
    com.netflix.exhibitor-rolling-hostnames-index=0
    com.netflix.exhibitor-rolling.java-environment=
    com.netflix.exhibitor-rolling.observer-threshold=0
    com.netflix.exhibitor.servers-spec=2\:10.0.0.163
    com.netflix.exhibitor.cleanup-period-ms=300000
    com.netflix.exhibitor.zookeeper-config-directory=/var/lib/dcos/exhibitor/conf
    com.netflix.exhibitor.auto-manage-instances-fixed-ensemble-size=3
    com.netflix.exhibitor.zookeeper-install-directory=/opt/mesosphere/active/exhibitor/usr/zookeeper
    com.netflix.exhibitor.check-ms=30000
    com.netflix.exhibitor.zookeeper-log-directory=/var/lib....

    If you look at the highlighted lines, you may notice something. What happened to your other master nodes, you ask? Well, I don’t have an answer, but there’s a workaround.

    Edit those two (highlighted in red) lines to include all your servers. Make sure to give them an id.

    com.netflix.exhibitor-rolling.servers-spec=2\:10.0.0.163,1\:10.0.4.50,3\:10.0.2.174
    com.netflix.exhibitor.servers-spec=2\:10.0.0.163,1\:10.0.4.50,3\:10.0.2.174

    Now, give your entire cluster a few minutes while all master nodes stop being asshats and start to discover each other. Once Exhibitor is happy, DC/OS stops being whiny. All your services will be up, and you’ll soon be able to login to your DC/OS UI.

    I hope that was helpful. I wasted an entire day (well I got paid to do it) trying to figure this out.

Posted in Amazon Web Services, Linux, Tech. | Tagged , , , , , , , | Leave a comment

DC/OS Kill Mesos Framework

You want to kill a Mesos framework but you’ve no idea how? You’ve looked at this page but it still doesn’t make sense? Then here’s what you need to do to kill a framework on Mesos.

In my case, I have Spark running on DC/OS. In this particular situation, I had Spark in a limbo state not running any tasks we were throwing at it. Our resources were at 100% utilization but none of our tasks were really running, although their status said otherwise. After trying in vain to kill using “dcos spark kill” I tried to kill individual drivers using this:

curl -XPOST https://<your-mesos-endpoint>/master/teardown -d 'frameworkId=6078e555-358c-454f-9359-422f1b6026bd-0002-driver-20161203012921-30627'

But, even though it deleted the drivers from Mesos, the drivers continued to run in the cluster. I figured there had to be a better way to do this. And that’s when I decided to kill the Spark framework instead:

curl -XPOST https://<your-mesos-endpoint>/mesos/master/teardown -d 'frameworkId=6078e555-358c-454f-9359-422f1b6026bd-0002'

And that worked like magic. It killed all the running and pending drivers and also killed Spark.

Once that was done, I removed Spark’s exhibitor entry, and reinstalled Spark.

Posted in Tech. | Tagged , , , , , , | Leave a comment